ISTQB Specialist (CT-PT) Mock Exam #3 — Questions & Answers
Every question in this mock exam, with the correct answer marked and a written rationale behind each option below — for reading and review, not a timed run.
Chapter 1 · Basic Concepts — 6 questions
Which of the following best describes stress testing as it is defined for performance testing?
Testing the behaviour of a system at or beyond the limits of its anticipated or specified workload, or with reduced availability of resources such as processors or memory.
This is the definition of stress testing: the system is pushed outside its expected operating range, or starved of resources, to observe how and where it breaks down.
Testing the ability of a system to handle increasing levels of anticipated, realistic load over a defined period of time.
This describes load testing, which stays within the range of load the system is expected to face rather than exceeding it.
Testing whether the system can be expanded to meet future performance efficiency requirements, and where the practical limits of that expansion lie.
This describes scalability testing, which is concerned with the effect of growing the system or its workload, not with behaviour beyond the specified limits of the current configuration.
Testing the stability of a system over an extended period of continuous execution at a load representative of normal operation.
This describes endurance testing, which looks for problems that emerge over time such as memory leaks or database growth, at ordinary load levels.
Stress testing deliberately takes the system to or past the limits of its anticipated or specified workload, or runs it with reduced resources such as fewer processors or less memory. The point is to learn how the system behaves beyond the range it was designed for, and whether it fails in a controlled way. Load, scalability and endurance testing all stay inside the anticipated range and ask different questions.
Which two of the following are principles of performance testing? (Choose two.)
Performance tests must be aligned with the expectations of the relevant stakeholders, whose performance needs define what counts as acceptable behaviour.
Correct. Stakeholder expectations are the reference against which measurements are judged, because performance testing has no simple built-in pass/fail oracle.
Performance test results must be reproducible, so that repeating the same test under the same conditions yields comparable measurements.
Correct. Without reproducibility a measurement cannot be compared with a baseline or with a later run, and any observed change cannot be attributed to a cause.
Performance testing may begin once functional testing has been completed and the system is feature-complete, since partial systems cannot yield meaningful measurements.
Incorrect. Performance testing is feasible on a complete or a partial system, and static activities such as reviewing the database schema or the network architecture can start well before the system is feature-complete.
Performance testing is primarily a production activity: measurements taken before release are treated as indicative background information rather than as test results.
Incorrect. Production monitoring complements performance testing, but the discipline is built around planned tests in a controlled environment where conditions can be repeated.
A performance test is considered to have passed when resource utilisation on every server node stays below 75% for the duration of the run.
Incorrect. No such utilisation principle exists; on the contrary, a system can show utilisation well under 75% while its response times are an order of magnitude worse than required.
Among the principles of performance testing are that tests must be aligned with the performance expectations of the relevant stakeholders — they define what 'acceptable' means — and that results must be reproducible, so that the same test under the same conditions produces comparable measurements. The other options either invent a rule the discipline does not state, or contradict the principle that performance testing can be carried out on a complete or a partial system, early and within available budget and timescales.
At the launch of a new competitive season, an online game expects roughly 40 000…
At the launch of a new competitive season, an online game expects roughly 40 000 players to press 'Find match' within the same short window. The team's concern is not the total traffic volume over the day but the defects that appear specifically when a very large number of identical operations reach the matchmaking service at the same moment: row locking on the player-rating table, exhaustion of the database connection pool, and deadlocks between the matchmaking and the rating update transactions. Which type of performance testing is primarily aimed at this concern?
Concurrency testing
Correct. Concurrency testing targets the effects of many users performing the same action simultaneously, which is where locking, deadlock and pool-exhaustion defects surface.
Capacity testing
Capacity testing establishes how many users or transactions the configuration can support while still meeting its performance objectives; it does not focus on the simultaneity of identical operations.
Spike testing
Spike testing examines how the system reacts to a sudden sharp rise and subsequent fall in load; the concern described here is contention between simultaneous identical transactions rather than the shape of the load curve.
Endurance testing
Endurance testing runs a representative load for a long period to reveal problems that build up over time, such as memory leaks; it says nothing about a single moment of mass simultaneous access.
Concurrency testing focuses on what happens when many users perform the same operation at the same instant. Its typical findings are exactly the ones described — locking, deadlocks and contention for shared resources such as connection pools — which do not appear when the same total volume of work is spread out over time.
A food-delivery dispatch platform currently sustains about 6 000 orders per hour…
A food-delivery dispatch platform currently sustains about 6 000 orders per hour at its evening peak. The business plans to enter new cities and expects roughly three times that volume within 18 months. The performance test manager is asked to determine whether adding application server nodes and database read replicas raises the achievable order rate in proportion to the hardware added, and at which point adding further nodes stops improving the achievable rate. Which type of performance testing is being asked for?
Scalability testing
Correct. Scalability testing determines whether the system can be grown to meet future requirements and where the practical limits of that growth lie.
Capacity testing
Capacity testing would establish how many orders per hour the current configuration can sustain while meeting its objectives; it does not address the effect of expanding that configuration.
Load testing
Load testing verifies behaviour under anticipated realistic load levels on a given configuration, rather than comparing configurations of different sizes.
Stress testing
Stress testing pushes the system to or past its specified limits to see how it fails; the objective described here is proportional growth of achievable throughput, not failure behaviour.
Scalability testing is concerned with the system's ability to meet future performance efficiency requirements, which may call for larger capacity, and with identifying the limits of that expansion. The question here is explicitly about the effect of adding resources, which distinguishes it from testing what the present configuration can do.
A live sports streaming provider wants the load for an upcoming championship…
A live sports streaming provider wants the load for an upcoming championship final to originate from real consumer devices on real ISP networks across a dozen countries. The team accepts that the exact number of participants, their device mix and the precise timing of their actions cannot be controlled, and that the run cannot be repeated identically. Which approach to load generation matches this decision?
Load generation through crowds
Correct. Crowd-based generation supplies real devices, real networks and real geographic spread, and its known drawback is limited control and repeatability.
Load generation through captured communication protocols
Replaying recorded protocol traffic from controlled load generators gives good repeatability and volume, but the traffic still originates from the test infrastructure rather than from real consumer devices and networks.
Load generation through the application programming interface
Driving the system through its API bypasses the client software entirely, so it measures server-side behaviour and cannot reproduce real device and network diversity.
Load generation through the user interface
Driving real client user interfaces gives end-to-end timings, but the clients are controlled machines in the test environment, so the diversity of consumer devices and ISP networks is not represented.
Load generation through crowds uses a large number of real people on their own devices and networks. It gives realistic device, network and geographic diversity that a controlled laboratory cannot easily reproduce, at the cost of control and repeatability — precisely the trade-off the team has accepted.
During a test of a messaging platform, response times stayed inside the agreed…
During a test of a messaging platform, response times stayed inside the agreed target while the number of connected clients grew. When the configured connection limit was reached, the platform did not reject new connections with a clear 'service busy' response. Instead it returned internal server errors containing stack traces, dropped a large number of already-established client sessions, and had to be restarted before it would accept traffic again. Which common performance efficiency failure mode does this behaviour illustrate?
Inelegant handling of error conditions once the limits of the system are reached, typically caused by insufficient resource pools, undersized queues or stacks, or time-outs that are set too aggressively.
Correct. Acceptable behaviour up to the limit followed by internal errors, lost sessions and a required restart is the signature of poor handling of the boundary condition itself.
Degradation of response time over the duration of operation, typically caused by memory leaks, disk fragmentation or growth of the database.
This failure mode shows up as a gradual worsening of measurements during a long run; here the response times were within target until the connection limit was hit.
Slow response under all levels of load, including light load, typically caused by inefficient algorithms or unoptimised database queries.
This failure mode would have produced poor response times from the start of the run, which contradicts the observation that targets were met while the client count grew.
Slow response under moderate to heavy load caused by saturation of a resource such as processor, memory or network bandwidth.
Resource saturation produces a progressive slowdown as utilisation rises; the reported behaviour is an abrupt functional failure with dropped sessions rather than a gradual increase in response time.
This is the failure mode in which error conditions at the limits of the system are handled inelegantly. Typical causes are resource pools that are too small, queues or stacks that are undersized, and time-outs set too aggressively. The distinguishing evidence is that behaviour was acceptable right up to the limit and then failed abruptly and destructively, rather than degrading.
Chapter 2 · Performance Measurement Fundamentals — 4 questions
Which of the following is a metric of the operational environment rather than of the technical or the business environment?
The elapsed time required to restore the system from a backup after a failure.
Correct. Restoration from backup is one of the operational procedures whose timing forms the operational environment metrics, together with start-up, shutdown, backup, resumption and alerting.
Processor and memory utilisation on the application server during the peak period of the run.
Resource utilisation is a technical environment metric, collected per server alongside network latency, disk space and input/output rates.
The number of customer orders the system completes per hour during the business peak.
Orders per hour is a business environment metric, in the same group as business process efficiency and compliance with service level agreements.
The 90th percentile response time of the login transaction measured across the steady state.
Transaction response time and its percentiles are technical environment metrics describing the behaviour of the system under load.
Operational environment metrics describe the operational procedures around the system: start-up, shutdown, backup, resumption, restoration from backup and alerting. Processor utilisation and percentile response times belong to the technical environment; orders per hour belongs to the business environment.
Which two statements about performance monitoring tools as a source of performance metrics are correct? (Choose two.)
They can be deployed in the production environment after release, where they capture the behaviour of real usage that a test environment is unlikely to reproduce exactly.
Correct. Monitoring in production is an explicit use of these tools and provides input for later performance test planning and for capacity planning.
They can support the detection of denial-of-service and distributed denial-of-service attacks, because such attacks show up as anomalous resource and traffic patterns.
Correct. Continuous observation of resource consumption and traffic makes these tools useful for spotting attack patterns as well as ordinary performance problems.
Their primary function is to generate the transaction load for a performance test, with the measurement of resource consumption as a secondary role.
Incorrect. Generating load is the role of performance test tools; monitoring tools observe the system under test and its infrastructure without driving it.
They are the usual source for identifying deadlocks and database exceptions, because these conditions are exposed as resource counters rather than as recorded events.
Incorrect. Deadlocks, database exceptions and time-outs are recorded as events in application and database logs, which makes log analysis tools the usual source for them.
They should be configured to collect every counter available at the highest sampling frequency, so that no anomaly can escape observation during the run.
Incorrect. Excessive collection risks the probe effect, in which the act of measuring changes the behaviour of the system under test and distorts the very measurements being gathered.
Performance monitoring tools are used both during testing and in the production environment after release, where they capture the behaviour of real usage. Because they observe resource and traffic patterns continuously, they also support the detection of denial-of-service and distributed denial-of-service attacks. Generating load is the role of performance test tools, and deadlocks and SQL exceptions are typically found through log analysis tools.
During the month-end close of an ERP system, the consolidation step takes 4…
During the month-end close of an ERP system, the consolidation step takes 4 hours 40 minutes against a business expectation of about 30 minutes. Monitoring over the whole step shows processor utilisation at 38% on the application server and 44% on the database server, memory utilisation below 60% on both, and no network link above a third of its capacity. A developer concludes that because no resource is anywhere near saturation, the measurements show the system performing correctly and the business expectation must be unrealistic. Which statement best reflects the correct interpretation of these results?
Low utilisation and an unacceptable elapsed time can coexist, so the results must be interpreted against the expectations of the stakeholders rather than against utilisation figures, and the absence of saturation is itself a finding that points towards waiting rather than computation.
Correct. Utilisation well below saturation together with an elapsed time an order of magnitude beyond expectation is a documented pattern; it indicates the time is spent waiting on something not represented in these counters.
Since no resource is saturated, the measured elapsed time is the best that the current architecture can deliver, and the correct response is to renegotiate the acceptance criterion with the business.
Incorrect. Unsaturated resources do not demonstrate that the elapsed time is a hard architectural limit; they suggest the opposite, namely that capacity is available and something else is holding the work up.
The combination of low utilisation and a long elapsed time indicates that the monitoring tool has produced faulty figures, so the run should be repeated with a different tool before any conclusion is drawn.
Incorrect. This combination is a common and expected outcome rather than a symptom of instrumentation failure, so treating it as a tooling defect discards a genuine finding.
Utilisation below 75% on all servers is the accepted threshold for a passing performance test, so the consolidation step meets its performance objectives and no further analysis is required.
Incorrect. There is no such general pass threshold, and a utilisation figure cannot override an elapsed time that misses the stakeholders' expectation by nearly a factor of ten.
Raw measurements taken in isolation are misleading. A system can show resource utilisation far below saturation while its response or elapsed time is an order of magnitude worse than required — typically because the time is spent waiting rather than computing. Performance testing has no simple built-in test oracle, so results are interpreted against the expectations of stakeholders, not against utilisation thresholds.
A service that generates PDF account statements has never been measured under controlled load. The team has just replaced its rendering library and wants to report to management how much the change improved performance. What is the principal consequence of having no baseline measurement?
There is no reference set of measurements to compare the new results with, so the size of any improvement or regression cannot be quantified and no trend over time can be demonstrated.
Correct. This is the core project risk of not measuring: without a baseline there is nothing to compare against, so changes in performance remain a matter of opinion.
New measurements cannot be gathered at all until a baseline has been recorded, because performance test tools derive transaction response times relative to a stored baseline run.
Incorrect. Response times are measured directly by the tool's timers; a baseline is needed for comparison, not for measurement to be possible.
The missing baseline affects only the presentation of results in the report, since the measurements themselves remain directly comparable with those of any later run of the same test.
Incorrect. Comparability is exactly what is lost: a single set of numbers with nothing to compare it against cannot show whether the library change helped or hurt.
The team should compare the new results against published industry averages for document rendering services, which act as the baseline whenever local historical data is unavailable.
Incorrect. Figures from other systems were produced on different hardware, data volumes and workloads, so they cannot serve as a baseline for this system's measurements.
A baseline is the reference set of measurements against which later runs are compared. Without one, a new measurement stands alone: an improvement or a regression cannot be quantified, trends cannot be shown over time, and judgements about performance fall back on subjective impressions.
Chapter 3 · Performance Testing in the Software Lifecycle — 7 questions
A performance test team is examining the stated performance requirements, the…
A performance test team is examining the stated performance requirements, the service level agreements agreed with the customer, the documented IT architecture and the organisation's capacity planning forecasts, in order to decide what has to be measured and under what conditions. Within the performance testing activities, which activity does this work belong to?
Test analysis
Correct. Analysis is where requirements, service level agreements, the IT architecture and capacity planning documents are studied to derive what must be measured.
Test planning
Planning decides on the test environment, the test data, the tools to be used and the performance risks to be addressed, rather than deriving the measurement targets from architecture and agreements.
Test implementation
Implementation is where scripts are built and parameterised and where individual test cases are assembled into executable scenarios.
Test execution
Execution runs the prepared scenarios against the system under test and collects the measurements; the analytical work described has to be complete before this point.
Test analysis is the activity in which requirements, service level agreements, the IT architecture and capacity planning information are examined to determine what needs to be tested and under which conditions. Planning is concerned with environments, data, tools and risks; implementation builds the scripts and scenarios; execution runs them.
While designing the performance tests for a national electronic identification service, the test manager requires that individual performance test cases be built as small, self-contained modules. Which two statements correctly describe the reasoning behind this design choice? (Choose two.)
A small set of modules, each representing one operation, can be recombined into many different scenarios without being rewritten for each of them.
Correct. Modules act as building blocks: different operational profiles reuse the same operations in different proportions and sequences.
When an operation changes, only the module that represents that operation has to be updated, which contains the maintenance effort across every scenario using it.
Correct. Localising change to one module is the maintenance argument for modular design, and it matters because performance scripts are sensitive to application changes.
A modular script can be recorded once and replayed unchanged by every virtual user, because the module boundary isolates the user-specific data from the script logic.
Incorrect. Modularity does not address data: each virtual user still needs its own input data through parameterisation, and dynamic server values still need correlation.
Modular test cases take the place of operational profiles, because each module already carries the proportion in which it is to be executed.
Incorrect. A module describes one operation; the proportions in which operations are executed come from the operational profiles and are applied when the scenario is assembled.
Because each module is a self-contained unit, the measurements it produces are independent of the other modules executing in the same scenario.
Incorrect. All modules in a scenario compete for the same system resources, so their measurements influence one another; that interaction is a large part of what the test is meant to reveal.
Performance test cases are designed as modular building blocks so that a small set of modules, each representing one operation, can be recombined into many different scenarios, and so that a change to one operation is absorbed by updating a single module rather than every scenario that exercises it.
A messaging platform is deployed as a multi-tier architecture: a web tier that…
A messaging platform is deployed as a multi-tier architecture: a web tier that terminates client connections, an application tier that holds the routing and delivery logic, and a database tier that stores messages and delivery state. Which statement best characterises the category of performance risk specific to this class of architecture?
Any individual tier, or any communication link between two tiers, can independently become the bottleneck, so measurements have to be collected per tier and correlated to locate where the time is spent.
Correct. Multiple candidate bottlenecks distributed across tiers and their interconnections is the defining performance risk of a multi-tier deployment.
The risk is concentrated in the client device, because a multi-tier architecture moves a substantial part of the processing away from the servers and towards the client software.
Incorrect. A multi-tier architecture keeps processing on the server tiers; heavy client-side processing is a characteristic of thick-client designs, not of multi-tier ones.
Because every tier can be scaled independently, the performance risk reduces to selecting the number of instances per tier, and locating a specific bottleneck is not part of the exercise.
Incorrect. Independent scalability is an opportunity, not a substitute for diagnosis: adding instances to a tier that is not the bottleneck changes nothing.
The dominant risk is that all components share one set of physical resources, so unrelated processes on the same machine compete for the same processor, memory and disk.
Incorrect. Contention between co-located processes on a single machine is the characteristic risk of a single-computer architecture, not of a multi-tier deployment.
In a multi-tier architecture every tier, and every communication link between tiers, is a candidate bottleneck. A measurement taken only at the client tells you that something is slow but not which tier is responsible, so metrics have to be collected per tier and correlated in order to locate where the elapsed time is actually being spent.
A regional subsidiary runs its ERP system as a single installation on one…
A regional subsidiary runs its ERP system as a single installation on one physical server: the application, its database and the reporting service all execute on that machine, alongside a backup agent and a scheduled antivirus scan. Which performance risk is characteristic of this single-computer architecture?
Performance is bounded by the resources of that one machine, and processes unrelated to the business transactions compete for the same processor, memory and disk, so they can degrade those transactions.
Correct. Limited local resources shared by all co-located processes, including housekeeping tasks, is the defining risk of a single-computer architecture.
The principal risk lies in the speed and congestion of the public network segments between the components, which the project cannot control or reliably reproduce in a test.
Incorrect. Public network variability is a client-server risk; in a single-computer installation the components communicate inside one machine.
The principal risk is uneven load balancing, because incoming requests may be distributed unequally across the available processing units and hide the imbalance in aggregated results.
Incorrect. Load balancing risk presupposes several nodes among which work is distributed; there is only one node here.
The principal risk is that additional resources are provisioned automatically during the run, changing the configuration under measurement and making the results hard to reproduce.
Incorrect. Automatic provisioning during a run is a risk of dynamic, cloud-based architectures that can scale themselves, not of a fixed single-server installation.
In a single-computer architecture, performance is bounded by the resources of that one machine, and every process on it — including processes that have nothing to do with the business transactions, such as backup agents and antivirus scans — competes for the same processor, memory and disk. Scheduling and co-location therefore become first-order performance concerns.
A messaging platform team works in two-week iterations. It has added a…
A messaging platform team works in two-week iterations. It has added a ten-minute automated performance check to its continuous integration pipeline: on every merge, 60 virtual users run the send-message operation against a scaled-down environment, and the build fails if the 90th percentile response time moves by more than 10% from the previous run. Which statement best describes what this practice delivers and what it does not?
It detects performance regressions early and attributes them to a specific change, but because both the run duration and the environment are reduced it cannot establish whether the objectives are met at production scale.
Correct. Regression detection per build is the value; a scaled-down, ten-minute run is not evidence about production-scale behaviour, so full-scale tests remain necessary.
It establishes the production capacity of the system on every merge, so a full-scale performance test is needed only when the architecture itself is changed.
Incorrect. Capacity cannot be established on a scaled-down environment in ten minutes, and performance is not a linear function of the environment, so the figures do not transfer to production.
Because the environment is scaled down, the check yields no usable performance information and functions purely as a smoke test confirming that the pipeline itself still works.
Incorrect. Measurements from a consistent scaled-down environment are directly comparable with each other, which is exactly what makes relative regression detection valid.
It moves performance risk analysis out of the iteration, since any regression that matters to stakeholders will surface as a breach of the configured threshold.
Incorrect. A single threshold on one operation covers a narrow slice of the performance risks, so risk analysis stays an activity within the iteration.
Short automated performance checks inside continuous integration are the characteristic way performance testing is embedded in an iterative lifecycle. They give early, build-by-build detection of regressions at a cost the pipeline can absorb. Because both the duration and the environment are reduced, they cannot establish whether the system meets its performance objectives at production scale — that still requires full-scale performance tests.
A courier-facing dispatch application is a client-server system: the courier's…
A courier-facing dispatch application is a client-server system: the courier's mobile client communicates directly with the dispatch server over the public internet. Performance testing was carried out with the load generators placed on the same corporate network segment as the server. At the target load the 'accept assignment' transaction averaged 0.8 s with a 90th percentile of 1.1 s, comfortably inside the acceptance criterion of 2.0 s, and the test was signed off. After release, couriers in the field report that accepting an assignment frequently takes 5 to 9 s and occasionally times out. Server-side monitoring during those exact periods shows processor utilisation of 30 to 35%, no saturated database, no errors in the application log, and server-side transaction processing times of 0.7 to 0.9 s — matching the test almost exactly. Couriers connect over mobile networks of varying quality and, inside restaurants and shopping centres, over public wireless networks. Corporate traffic reaches the server across an internal link; field traffic arrives through an edge gateway performing deep packet inspection and then a load balancer. Which conclusion is best supported by this evidence?
Because server-side processing in the field matches the test, the additional time is spent in the network path and its intermediate components; the test excluded the client-server risks of connection speed, congestion, public wireless access, packet inspection and load balancing, so its result was never evidence about the courier's end-to-end time.
Correct. Identical server-side times with a large difference in perceived time localises the problem to the path between client and server, which is the risk category the test design left out.
The field reports point to a server-side capacity shortfall that the laboratory test never reached, so the next step is to repeat the test at a substantially higher load against the same corporate-network configuration.
Incorrect. Processor utilisation of 30 to 35% and unchanged server-side transaction times during the slow periods rule out a server capacity shortfall as the cause.
Since the server-side times agree with the test, the field reports describe a functional defect in the mobile client rather than a performance problem, and should be handled as a client software bug.
Incorrect. A client defect would not be expected to correlate with network quality and location as described; the evidence points to the transport path, which is a performance risk of the architecture.
The discrepancy shows that the 2.0 s acceptance criterion was written against the wrong metric, and it should be restated as a limit on server-side processing time so that it can be measured reliably.
Incorrect. The criterion expresses what the user experiences, which is the right thing to constrain; the defect is in a test design that measured only part of that path.
Server-side processing in the field matches the laboratory measurement, so the extra five to eight seconds are being spent outside the server: in the access network, the edge gateway performing packet inspection, and the load balancer. These are exactly the risks listed for a client-server architecture — connection speed, network congestion, use of public wireless networks, firewalls and packet inspection, and load balancing — and the test deliberately excluded all of them by placing the generators on the corporate segment. The test result was therefore never evidence about the elapsed time a courier experiences.
The month-end close in an ERP landscape is a system of systems. Three feeder…
The month-end close in an ERP landscape is a system of systems. Three feeder systems — point of sale, payroll and a subsidiary ledger — each publish their records onto a shared message queue as their nightly batch finishes. A consolidation service consumes from that queue and posts to the general ledger. The business requires the entire close to complete within 90 minutes. Measured in isolation, every component met its own agreed target: point-of-sale export 6 min against a target of 10, payroll export 4 min against 8, subsidiary ledger export 7 min against 10, and the consolidation service benchmarked at 1 400 records per second against a target of 1 200. End to end, the close took 3 h 10 min. During the run the depth of the queue between the feeders and the consolidation service rose from zero to 2.4 million messages and stayed above 2 million for more than two hours. Over the same period the consolidation service drained the queue at roughly 260 records per second while its own processor utilisation stayed at 22%, its memory was stable and it logged no errors. All three feeders finished publishing within the first 20 minutes. Which conclusion is best supported by this evidence?
The elapsed time is being consumed at the interfaces between the systems: the feeders deliver a burst that the consumer drains at a fifth of its standalone rate while waiting on the general ledger interface, so performance testing of this landscape must model and monitor the queues and hand-over timing between systems rather than each system alone.
Correct. Component targets all met, a queue holding over two million messages for two hours, and a consumer at 22% utilisation together localise the problem to the integration path between the systems.
The consolidation service is under-provisioned for the volume it receives, so adding processor capacity to that service is the change most likely to restore the benchmarked rate of 1 400 records per second.
Incorrect. At 22% processor utilisation the service has ample capacity in hand; adding more will not shorten time spent waiting on a downstream interface.
The feeder systems are the cause, because the queue would not have grown if they had published their records more gradually, so their individual export targets should be tightened to smooth the flow.
Incorrect. Smoothing the arrival pattern would lower the peak queue depth but not the total work, and the consumer's low drain rate — not the arrival burst — is what stretches the close to over three hours.
Since every measured component target was satisfied, the 90-minute end-to-end requirement is unachievable with this architecture, and the appropriate response is to renegotiate the requirement with the business.
Incorrect. A consumer idling at 22% utilisation indicates unexploited headroom in the current architecture, so the requirement cannot be declared unachievable before the interface constraint is investigated.
Every component satisfies its individual target, yet the end-to-end requirement fails by a wide margin, and the time is visibly accumulating in the queue between the systems. The consolidation service is not resource-constrained — 22% processor utilisation with a drain rate about one fifth of its standalone benchmark shows it is waiting on the interface to the general ledger, not computing. This is the characteristic performance risk of distributed systems and systems of systems: the buffers and queues between the systems, and the timing with which one system hands work to the next, must be modelled and monitored, because component-level targets say nothing about them.
Chapter 4 · Performance Testing Tasks — 20 questions
Two performance test objectives have been proposed for a national electronic…
Two performance test objectives have been proposed for a national electronic identification service. The first: "a citizen authenticating through the eID application receives a result within 3 seconds during the morning peak". The second: "the authentication service sustains 800 assertions per second with mean processor utilisation on each node below 70%". How should these two objectives be classified, and why does the performance test plan need both kinds?
The first is a user-based objective and the second a technical objective; both are needed because a user-based objective alone does not tell engineers what to build and monitor, while a technical objective alone does not show that the resulting experience is acceptable.
Correct. User-based objectives express the experience, technical objectives express what the system must do to deliver it, and a plan that carries only one of the two leaves either the engineers or the stakeholders without an answer.
The first is a technical objective because it states a measurable number of seconds, and the second is a user-based objective because the sustained assertion rate determines how many citizens can be served at once.
Incorrect. The classification follows whose perspective the objective is written from, not whether a number appears in it; a response time seen by a citizen is user-based however precisely it is quantified.
Both are technical objectives, since both are measured by the performance test tool; user-based objectives are recorded only in the service level agreement and lie outside the scope of the performance test plan.
Incorrect. User-based objectives belong inside the performance test plan, where they are the reason particular transactions are measured at all; being tool-measurable does not make an objective technical.
The first is an acceptance criterion and the second a test objective; because they belong to different sections of different documents they are not expected to be traceable to one another.
Incorrect. Both statements are test objectives, and objectives and acceptance criteria are deliberately traceable to each other so that a measured result can be judged against a stated need.
The first objective is user-based: it is expressed from the point of view of what a user experiences. The second is technical: it is expressed in quantities the system and its operators can act on directly. Both are needed, because a user-based objective on its own does not tell engineers what to build, configure or monitor, while a technical objective on its own does not demonstrate that the resulting experience is acceptable to the people who use the service.
Which two of the following items belong in a Performance Test Plan? (Choose two.)
The profiles to be executed — the operational profiles describing what users do, and the load profiles describing how many virtual users execute them over time.
Correct. Profiles are an explicit section of the Performance Test Plan, because they define the workload the test will apply.
The test data required, including how it will be extracted from production and anonymised before use in the test environment.
Correct. Test data is a section of the plan, and the plan is where the need for masking and its possible effect on data characteristics has to be recorded.
The executive summary of the measurements obtained during the run, written in non-technical language for business stakeholders.
Incorrect. An executive summary reports results and is a section of the performance test report, which is produced after execution.
The defect reports raised while the scenarios were being executed, together with their severity, priority and current status.
Incorrect. Defect reports are outputs of execution; the plan can define how defects will be handled but cannot contain reports that do not yet exist.
The recorded protocol scripts themselves, embedded in full so that the plan is a self-contained deliverable requiring no other artefacts.
Incorrect. Scripts are implementation artefacts referenced by the plan and maintained separately; embedding them would make the plan unusable as a planning document.
The Performance Test Plan is written before execution and describes what will be done: among its sections are the profiles to be executed, the system configuration, the test environment, the test tools, the relevant metrics, the acceptance criteria, the risks and the test data — including how that data will be obtained from production and anonymised. Result summaries and defect reports are outputs of execution and reporting, not contents of the plan.
While a protocol-level performance test is running against a market-data web portal, the team also has two workstations driving the real browser user interface with graphical-user-interface scripts, recording the times that a human user would perceive. Why is this technique used during execution?
A protocol-level script measures only the server and network part of the transaction, so a few interface-driven scripts running alongside it add the client-side rendering and processing time and verify that the protocol-level figures correspond to an acceptable end-user experience.
Correct. This is the standard verification technique: the protocol test supplies the volume, and the interface-driven scripts supply the end-to-end view that the protocol test structurally cannot produce.
The interface-driven workstations add load to the protocol-level test, which is the least expensive way of pushing the total number of virtual users past the limit imposed by the tool licence.
Incorrect. Interface-driven scripts are far more resource-hungry per user than protocol-level ones, so two workstations add a negligible amount of load; their value is the measurement, not the volume.
They provide a second independent measurement of server processing time, which is averaged with the protocol-level figure to reduce the measurement error of the run.
Incorrect. The two techniques measure different spans of time rather than the same quantity twice, so averaging them would mix client-inclusive and client-exclusive figures.
They stand in for client-side resource monitoring, because an interface-driven script reports the processor and memory consumption of the browser along with its timings.
Incorrect. An interface-driven script reports the times it observes; client resource consumption still has to be collected by monitoring tools on the client machines.
A protocol-level script exercises the server across the network and therefore measures the server and network portion of the transaction; it does not include the time the client software spends rendering and processing the response. Running a small number of graphical-user-interface scripts alongside the protocol-level load adds that client-side component, verifying that acceptable protocol-level figures actually correspond to an acceptable experience for a user.
The response-code breakdown reported for the steady state of a performance test…
The response-code breakdown reported for the steady state of a performance test of a live-score web application is: code 200 — 1 842 500 responses; code 302 — 96 200; code 304 — 610 400; code 404 — 12 900. Which statement correctly interprets the large number of 304 responses together with the small number of 404 responses?
The 304 responses show resources that were unchanged and therefore served from the client cache, reducing the work done by the server; the 404 responses show requests for resources that were not found and should be investigated, since the script may be requesting something that no longer exists.
Correct. 304 is a normal and beneficial outcome for cacheable assets, while 404 responses in a controlled test usually point at a script or environment problem that changes the workload actually applied.
The 304 responses are redirections that each add an extra round trip to the server, and the 404 responses show requests the server declined to serve because it was under load at that moment.
Incorrect. Redirection is code 302, not 304, and a 404 reports a resource that could not be found rather than a load-related refusal.
Both codes indicate server-side errors occurring under load, so their combined share of all responses should be reported as the failure rate of the test run.
Incorrect. Server-side error conditions are reported in the 500 range; 304 is a successful cache validation and 404 is a client-side error about a missing resource.
The 304 responses can be counted as equivalent to 200 responses when reporting throughput in bits per second, and the 404 responses indicate that the virtual user lacked authorisation for the resource.
Incorrect. A 304 carries no response body, so counting it as a 200 would overstate network throughput, and lack of authorisation is reported as 401 or 403 rather than 404.
A 304 response tells the client that the requested resource has not been modified, so the client serves it from its own cache and the server transfers no content — a large count of these is normal for a page with many static assets and it reduces the work the server does. A 404 response means the requested resource was not found; even a small count deserves investigation, because it often indicates that the script is still requesting a resource that no longer exists, which distorts the workload being applied.
A script for the 'place order' operation of a food-delivery application is…
A script for the 'place order' operation of a food-delivery application is instrumented with nested timers: an outer timer around the whole operation, and inner timers around the three steps 'load restaurant menu', 'submit basket' and 'confirm payment'. The script includes think time between the steps, representing the user reading the screen. For one execution the outer timer reports 6.4 s, while the three inner timers report 1.1 s, 0.9 s and 1.2 s. Which statement correctly explains the relationship between these measurements?
The inner timers measure the response times of the individual steps while the outer timer measures elapsed time, which also contains the think time between steps; the outer figure is therefore expected to exceed the sum of the inner ones and is not itself a transaction response time to compare against a response-time criterion.
Correct. Transaction response time plus think time equals elapsed time, so the 3.2 s difference between 6.4 s and the 3.2 s of measured steps is accounted for by the think time in the script.
The outer timer should equal the sum of the inner timers, so a difference of this size shows that the inner timers were placed incorrectly and that the script has to be re-instrumented before the results can be used.
Incorrect. With think time inside the outer timer the two figures are not expected to be equal, so the difference is the design of the script working as intended rather than an instrumentation defect.
The outer timer measures elapsed time on the server while the inner timers measure time observed at the client, so the 3.2 s difference between them is the network transfer time for the whole operation.
Incorrect. Both timers are implemented in the script and therefore both measure from the client side; neither reports a server-internal elapsed time.
Think time is excluded from all timers automatically by the tool, so the difference must represent server processing that took place outside the three instrumented steps.
Incorrect. Think time is excluded from the inner step timers by where they are placed, not automatically, and any timer that spans the pauses will include them.
The inner timers measure the transaction response times of the individual steps, totalling 3.2 s. The outer timer spans the whole operation and therefore also contains the think time between the steps. Transaction response time plus think time equals elapsed time, so the outer figure is expected to exceed the sum of the inner ones by the amount of think time — here also 3.2 s — and the outer figure is not a transaction response time that can be compared with a response-time acceptance criterion.
The test environment for a market-data web portal is being prepared. The team…
The test environment for a market-data web portal is being prepared. The team sets the Java heap size on the application servers to the value used in production, and installs a network emulation device between the load generators and the system under test, configured to add the latency and packet loss typical of consumer broadband connections. Which statement best explains the purpose of these two preparation steps?
Both steps remove differences between the test and production environments that materially change the measurements — runtime parameters govern memory and collection behaviour, network characteristics govern much of the perceived response time — and because performance is a non-linear function of the environment such differences cannot be corrected arithmetically afterwards.
Correct. Matching runtime parameters and emulating realistic network conditions are both about making the measured figures transferable to production, which arithmetic adjustment afterwards cannot achieve.
The heap size is tuned so that each load generator can host more virtual users, and the network emulation device is installed to reduce the bandwidth required between the generators and the system under test.
Incorrect. The heap being set is that of the application servers under test, not of the generators, and network emulation adds representative impairment rather than reducing bandwidth consumption.
Both steps are optimisations of the test infrastructure: they affect how quickly and how conveniently the test can be executed, but they do not change the measurements that the test produces.
Incorrect. Heap configuration and network latency both change response times and resource behaviour directly, which is precisely why they are aligned with production before measuring.
Network emulation stands in for generating load from several points of presence, and matching the heap size makes extrapolation from a scaled-down environment a linear calculation.
Incorrect. Emulated impairment on one path does not reproduce genuinely distributed origins, and no configuration choice makes extrapolation linear, because the environment influences performance non-linearly.
Both steps bring the test environment closer to production in respects that materially change measured performance. Runtime parameters such as heap size govern garbage-collection behaviour and memory limits; network characteristics govern a large part of the response time a user perceives. Because performance is a non-linear function of the environment, a difference in either respect cannot be corrected arithmetically after the fact, so it has to be removed before measuring.
A performance test report for a document rendering service contains two figures both labelled 'throughput': 210 transactions per second, and 340 megabits per second. A stakeholder asks whether these are two ways of expressing the same measurement. Which answer is correct?
No. System throughput counts units of work completed per unit of time, while network throughput measures data volume transferred per unit of time, and the two can move independently — enlarging the response payload raises the second while leaving the first unchanged.
Correct. The distinction between system throughput and network throughput matters because an objective stated in one of them constrains the other only loosely.
Yes. They are the same quantity expressed in different units, so a performance objective may be stated in either of them interchangeably depending on the audience for the report.
Incorrect. They measure different things, so an objective written in bits per second does not constrain the number of business transactions completed, which is usually what stakeholders care about.
No. The transactions-per-second figure describes the system under test while the megabits-per-second figure describes the load generators, so the two are measured on opposite sides of the test and should not appear in the same report.
Incorrect. Both figures describe traffic to and from the system under test, and both are standard entries in the same set of performance metrics.
No. Transactions per second is a business environment metric while megabits per second is an operational environment metric, so only the first can carry a requirement and the second is purely diagnostic.
Incorrect. Network throughput is a technical environment metric, not an operational one, and a bandwidth limit can perfectly well be the subject of a requirement.
System throughput and network throughput are different quantities. System throughput counts units of work completed per unit of time — transactions or business operations per second. Network throughput measures the volume of data transferred per unit of time, in bits per second. They can move independently of each other: enlarging the response payload raises network throughput while leaving the transaction rate unchanged, and vice versa.
A team is deciding whether to host the load generators for a live sports streaming test in its own laboratory or in the cloud. Which two statements about cloud-based load generation are correct? (Choose two.)
It makes it practical to obtain a large number of generators for a short period, paying only for the time used, and to originate load from several geographic points of presence.
Correct. Short-term elasticity and geographic spread are the two principal reasons for choosing cloud-based generation over a fixed internal laboratory.
Traffic from cloud generators reaches the system under test across the public internet and through the organisation's own edge components, so firewall rules and the capacity of those components have to be accounted for in the test design.
Correct. The path from the generators to the system becomes part of what is being measured, and edge components can themselves become the bottleneck.
Because cloud generators are provisioned on demand, their own resource consumption falls outside the scope of the test, since the provider sizes each instance to the load it is asked to produce.
Incorrect. Load generators must be monitored wherever they are hosted; a saturated generator reports inflated response times that belong to the generator rather than to the system under test.
A software-as-a-service load testing platform gives the tester direct operating-system level access to each generator, which an internally hosted laboratory cannot offer.
Incorrect. It is the internal laboratory that offers full access to the machines; a software-as-a-service platform typically exposes only the service's own interface.
It makes results more reproducible than an internal laboratory, because the provider allocates identical hardware and identical network conditions to every run.
Incorrect. Shared cloud infrastructure and internet paths vary between runs, which usually makes reproducibility harder than in a dedicated laboratory rather than easier.
Cloud-based load generation makes it practical to obtain many generators for a short period on a pay-as-you-go basis and to originate traffic from several geographic locations. Its consequence is that the traffic reaches the system under test across the public internet and through the organisation's own edge components, so firewall configuration and the capacity of those components become part of the test design. Generators still have to be monitored wherever they run, and cloud infrastructure is generally less — not more — uniform between runs than dedicated laboratory hardware.
A performance test of a ride-hailing platform is instrumented with three…
A performance test of a ride-hailing platform is instrumented with three independent tools: the load generation tool on the generator machines, an infrastructure monitoring agent on each server, and a database monitoring tool. During analysis the team notices that a burst of database lock waits reported by the database tool is timestamped 90 seconds earlier than the response-time spike reported by the load generation tool. Why is synchronising the clocks of all machines and tools a prerequisite for this kind of analysis?
Because a bottleneck is located by correlating measurements from different sources on one common timeline, and with unsynchronised clocks causally related events appear at different times, so the correlation either fails or points at the wrong cause.
Correct. Correlation across tools is the core analysis technique, and it is only as trustworthy as the timeline the samples share.
Because the load generation tool derives each transaction response time from the difference between the server clock and the client clock, so any offset between them would make every reported response time wrong by that offset.
Incorrect. A response time is measured by a timer inside the script using a single clock, so an offset between machines does not distort the response time itself.
Because the monitoring tools write into a shared result repository that is indexed by timestamp, and samples carrying colliding timestamps would overwrite one another and be lost from the result set.
Incorrect. Result repositories distinguish samples by source and metric as well as by time; the problem caused by clock drift is misinterpretation, not data loss.
Because unsynchronised clocks alter the think times that the virtual users apply between steps, which changes the throughput the scenario actually achieves during the run.
Incorrect. Think time is produced by a delay inside the script measured on the generator's own clock, so it is unaffected by differences between machines.
Locating a bottleneck depends on correlating measurements taken by different tools on a single common timeline. If the clocks of the machines are not synchronised, events that are causally related are recorded at apparently different times: the analyst either fails to connect them, or connects the response-time spike to whatever happened to be recorded at the same apparent moment, and reaches a wrong conclusion.
During implementation, the individual performance test scripts written for a messaging platform are assembled into a scenario. Which two statements correctly describe what assembling a scenario involves? (Choose two.)
The scripts are combined in the proportions taken from the operational profiles, so that the mix of operations executed resembles the mix expected in real operation.
Correct. The operational profiles supply the relative weights of the operations, and the scenario is where those weights are turned into an executable mix.
The load profile is applied to the scenario, specifying how many virtual users execute each script over time, including the ramp-up, the steady state and the ramp-down.
Correct. The load profile is the time dimension of the scenario: it turns a mix of operations into a defined pattern of load.
Each script is executed by only one virtual user at a time, so that the measurements it produces stay free of interference from the other scripts running in the same scenario.
Incorrect. Scripts run concurrently at the multiplicities the load profile specifies, and the resulting contention between them is a substantial part of what the test is designed to expose.
The scenario is recorded afresh as one combined script covering every operation, which then supersedes the individual scripts and reduces the maintenance effort.
Incorrect. The individual scripts remain the maintained artefacts precisely because they are modular; merging them into one recording would destroy that reuse.
The scenario fixes the order in which the scripts execute, because the operations have to be performed as a strict sequence for the measurements to be valid.
Incorrect. Different virtual users perform different operations independently; a strict global sequence would not represent how the system is actually used.
A scenario brings the scripts together in the proportions given by the operational profiles, so that the mix of operations executed resembles the mix expected in operation, and applies the load profile that determines how many virtual users execute each script over time, including ramp-up, steady state and ramp-down. The scripts continue to exist as separate, individually maintained artefacts, and they run concurrently and therefore influence one another's measurements.
The authentication service of a national electronic identification system…
The authentication service of a national electronic identification system behaves as an open system: requests arrive from the population at large, so the number of requests in flight is governed by the rate at which they arrive rather than by a fixed number of looping virtual users with think time between iterations. During the morning peak, authentication requests arrive at an average rate of 250 per second. The average time a request spends inside the system, measured from its arrival to the completion of its response, is 0.4 s. The service is in steady state throughout the measurement window, so the rate of completions equals the rate of arrivals. On average, how many requests are inside the system at the same time, and what distinguishes this calculation from the closed-system model?
About 100 requests, calculated as the arrival rate multiplied by the average time in the system (250 x 0.4). In a closed model the population is instead fixed at the number of virtual users and throughput follows from that number divided by the sum of processing time and think time.
Correct. 250 per second x 0.4 s = 100 requests in the system. The open model is driven by an arrival rate, the closed model by a fixed user population and its think time.
About 625 requests, calculated by dividing the arrival rate of 250 per second by the average time in the system of 0.4 s, since concurrency in an open system is the arrival rate per unit of service time.
Incorrect. Dividing gives 625 but is dimensionally wrong: requests per second divided by seconds yields requests per second squared, not a number of requests. The two quantities must be multiplied.
250 requests, because in steady state the number of requests present inside an open system equals the arrival rate expressed per second, the service time affecting only the response each request receives.
Incorrect. Arrival rate and concurrency coincide only when the average time in the system happens to be exactly one second; at 0.4 s each request occupies the system for less than a second, so fewer are present.
It cannot be determined from these figures, because the number of requests being handled concurrently depends on the think time of the users, which has not been given.
Incorrect. Think time belongs to the closed model, where a fixed set of virtual users pauses between iterations. In an open system the arrival rate already describes how work enters the system.
In an open system in steady state, the average number of requests inside the system is the arrival rate multiplied by the average time each request spends there: 250 requests per second x 0.4 s = 100 requests. In a closed model the population is fixed at the number of virtual users, and system throughput follows instead from the number of virtual users divided by the sum of processing time and think time. The two models are parameterised differently, and think time has no place in the open-system calculation at all.
A market-data distribution platform runs on six application nodes in production…
A market-data distribution platform runs on six application nodes in production. The performance test environment contains two nodes of the same specification, attached to a separate database tier configured identically to the production one. In the test, the platform sustained 1 150 messages per second with response times inside the acceptance criteria, and the two test nodes reached 78% processor utilisation at that rate. The database tier stayed below 40% utilisation throughout. The project manager asks for a single number to report as the production capacity of the platform. Which statement correctly describes what may and may not be concluded?
Scaling by the node ratio gives roughly 3 450 messages per second as an indicative upper figure for six nodes, but it cannot be asserted as production capacity, because the shared database tier, network paths and load balancing do not scale with the node count and any of them may bind first.
Correct. The arithmetic is a defensible upper estimate; treating it as a measured capacity ignores that performance is a non-linear function of the environment.
Production capacity is 3 450 messages per second, since the two environments are configured identically and the number of application nodes is the only difference between them, which makes the relationship linear.
Incorrect. An identical configuration of individual nodes does not make the whole system scale linearly; the components shared between the nodes are exactly what breaks proportionality.
Production capacity is 1 150 messages per second, because a throughput figure measured in a test environment is the figure that must be reported for the system, irrespective of how many nodes are deployed in production.
Incorrect. This discards the known difference between the environments and would understate the production system, which has three times the application capacity.
No numerical statement about production may be derived from a scaled-down environment, so the measurement can be used only for comparing successive builds with one another.
Incorrect. Extrapolation from a reduced environment is a normal and expected activity; what is required is that its assumptions and its uncertainty be stated, not that it be avoided.
The measured 1 150 messages per second characterises the two-node test configuration. Scaling by the ratio of nodes gives 3 450 messages per second as an indicative upper figure for six nodes, and it is legitimate to report it as such. It cannot be asserted as the production capacity, because performance is a non-linear function of the environment: the database tier, the network paths and the load-balancing behaviour do not triple along with the application nodes, and any of them may become the limiting factor well before 3 450 is reached. Validation on the production configuration is required before the figure becomes a claim.
During a live match, clients of a sports streaming service repeatedly poll a…
During a live match, clients of a sports streaming service repeatedly poll a scoreboard endpoint. A load test of that endpoint measures an average response size of 50 000 bytes and a sustained rate of 900 requests per second. The system under test is attached to the network by a link of 1 gigabit per second. Monitoring shows that unrelated traffic consumes 40% of that link continuously throughout the test window. Ignore protocol overhead, treat 1 gigabit per second as 1 000 megabits per second, and treat 1 megabit as 1 000 000 bits. What network throughput does the scoreboard traffic generate, and is the link adequate for it?
360 megabits per second, and the link is adequate: 50 000 bytes x 900 gives 45 000 000 bytes per second, which is 360 000 000 bits per second, against about 600 megabits per second still free on the link.
Correct. The byte-to-bit conversion gives 360 megabits per second, and 40% of 1 000 megabits per second in use leaves 600 megabits per second available, so there is roughly 240 megabits per second of headroom.
45 megabits per second, obtained as 50 000 multiplied by 900 and divided by one million, and the link is adequate with a very large margin remaining.
Incorrect. This leaves out the conversion from bytes to bits: 45 000 000 bytes per second is 360 megabits per second, eight times the figure quoted.
2 880 megabits per second, and the link is inadequate, because the scoreboard traffic alone exceeds the total capacity of the link before the existing 40% is even taken into account.
Incorrect. This applies the factor of 8 twice. The conversion from bytes to bits is performed once, giving 360 rather than 2 880 megabits per second.
360 megabits per second, and the link is inadequate, because the 40% of capacity already consumed by other traffic leaves only 400 megabits per second available for the test traffic.
Incorrect. The throughput figure is right but the headroom is not: 40% of 1 000 megabits per second is 400 in use, which leaves 600 megabits per second free, comfortably above 360.
Network throughput is a data volume per unit of time and is reported in bits per second, so the byte figure has to be converted. 50 000 bytes x 900 requests per second = 45 000 000 bytes per second; multiplied by 8 bits per byte this is 360 000 000 bits per second, or 360 megabits per second. Other traffic uses 40% of the 1 000 megabit link, leaving about 600 megabits per second available, so 360 megabits per second fits with roughly 240 megabits per second of headroom.
The service level agreement for a food-delivery dispatch platform requires that…
The service level agreement for a food-delivery dispatch platform requires that, during the evening peak, the platform dispatch 18 000 orders per hour. In the load test the platform sustained 4.2 dispatches per second across a 40-minute steady state, with all response times inside their limits and no failed transactions recorded. The virtual user status report shows every user passing. What business throughput did the platform achieve, and what is the shortfall against the contractual requirement?
15 120 orders per hour, which falls short of the requirement by 2 880 orders per hour, or 16% of the required rate.
Correct. 4.2 x 3 600 = 15 120 per hour; 18 000 - 15 120 = 2 880; and 2 880 / 18 000 = 16%, the requirement being the correct base for a shortfall against a service level agreement.
15 120 orders per hour, which falls short of the requirement by 2 880 orders per hour, or 19% of the rate the platform actually achieved.
Incorrect. The rate is right and the absolute gap is right, but the percentage is taken against the achieved figure: 2 880 / 15 120 = 19%. A shortfall against an agreement is expressed as a share of what was required.
15 120 orders per hour, which satisfies the requirement once the 40-minute steady state is scaled up to a full hour by a factor of 1.5, giving 22 680 orders per hour.
Incorrect. The figure of 15 120 is already an hourly rate derived from a per-second rate; scaling it again by the length of the steady state double-counts the time.
252 orders per hour, a shortfall of about 98.6%, obtained by multiplying the sustained rate of 4.2 dispatches per second by 60.
Incorrect. Multiplying by 60 converts a rate per second into a rate per minute. Reaching a rate per hour requires multiplying by 3 600.
The achieved business throughput is 4.2 dispatches per second x 3 600 seconds = 15 120 orders per hour. The shortfall against the required 18 000 is 2 880 orders per hour. Expressed as a percentage of the requirement — which is the figure the service level agreement is about — that is 2 880 / 18 000 = 16%. The steady state is not scaled up: a rate per second converts directly to a rate per hour regardless of how long the steady state itself lasted.
A service that renders PDF account statements was run for 60 minutes of steady…
A service that renders PDF account statements was run for 60 minutes of steady state at a constant 900 virtual users. The acceptance criterion for the 'Generate account statement' transaction is a response time of 2.00 s. Throughput held at 148 transactions per second for the whole hour, processor utilisation on the application server stayed between 61% and 64%, no transaction failed, and the 90th percentile response time was 1.31 s. The graphs below show the average and maximum response time of the transaction, and the used heap of the Java virtual machine hosting it.
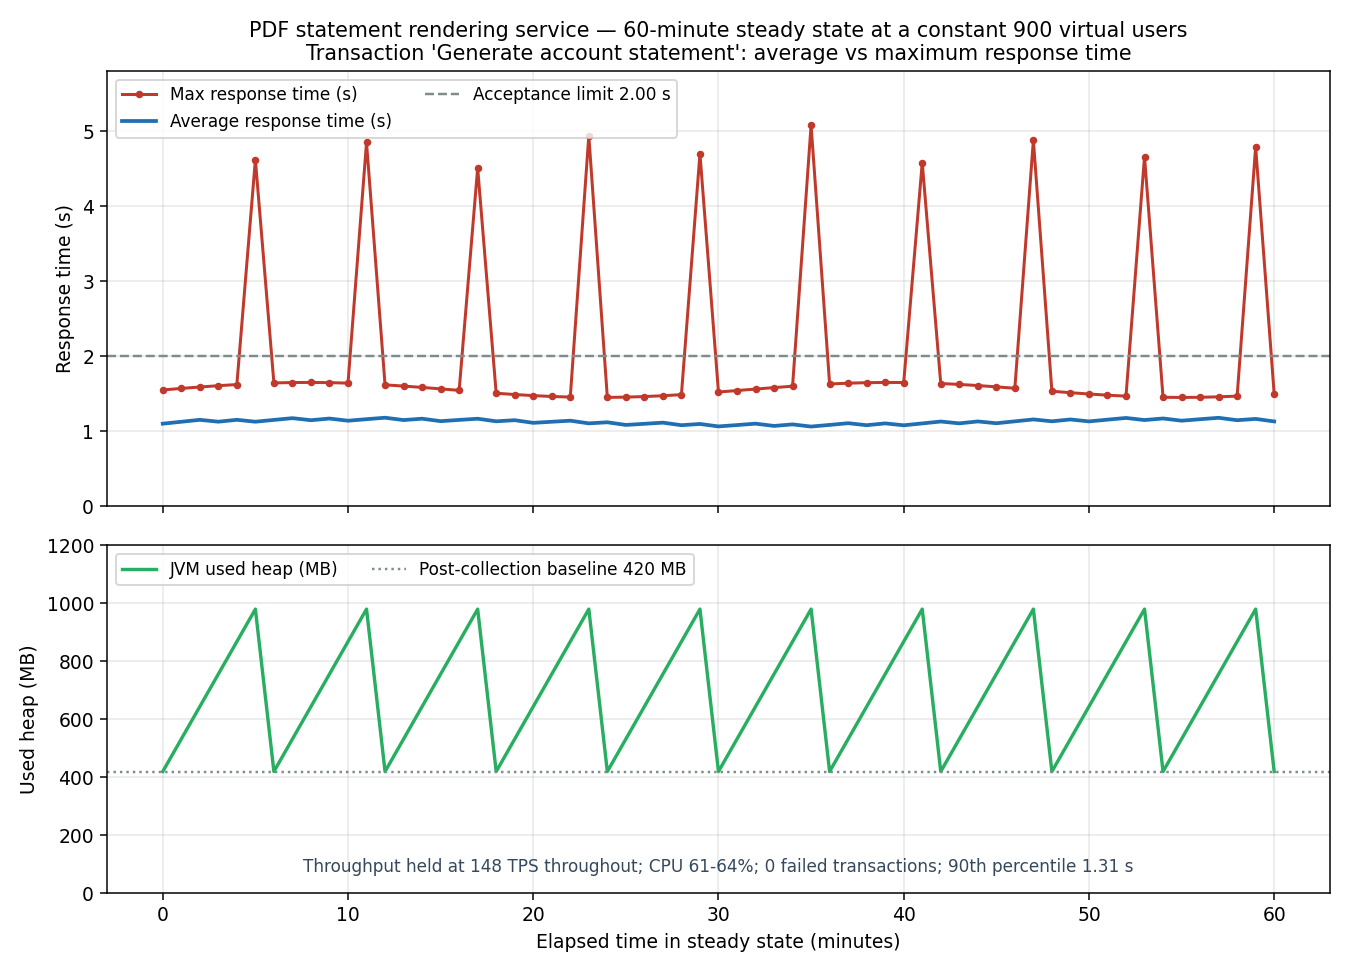
Which conclusion is best supported by this evidence, and what does it say about the possibility of a memory leak?
The maximum spikes coincide with the heap returning to its baseline, identifying them as garbage-collection pauses that briefly suspend processing; it is not a memory leak, because the post-collection baseline stays at 420 MB and neither the average response time nor the throughput drifts over the hour.
Correct. Alignment of the spikes with the collection points identifies the mechanism, and the constant post-collection baseline is what rules a leak out.
The sawtooth shape of the heap graph shows memory being allocated and not released, so the response-time spikes are the early stage of a memory leak that a longer endurance run would turn into an outright failure.
Incorrect. A sawtooth that returns to the same low point is the normal signature of healthy allocation and collection; a leak shows itself as a rising baseline, with each collection recovering less than the one before.
The spikes indicate intermittent saturation of the processor on the application server, since bursts of requests arriving close together would drive utilisation to its limit for a few seconds at a time.
Incorrect. Processor utilisation was measured at 61% to 64% throughout, and the load was a constant 900 virtual users, so there were neither arrival bursts nor saturation to explain the spikes.
Since both the average response time and the 90th percentile stay well inside the 2.00 s criterion and no transaction failed, the maxima are statistical outliers of no practical consequence and the transaction meets its acceptance criteria.
Incorrect. The spikes recur about every six minutes at 148 transactions per second, so a substantial number of real requests take roughly 5 s; a recurring, explainable pattern is a finding rather than an outlier to be discarded.
The maximum response time spikes line up with the moments at which the used heap falls back to its baseline, which identifies them as garbage-collection pauses: request processing is suspended briefly while the collection runs, so a few transactions in each interval take several seconds while the average is untouched. This is specifically not a memory leak, because after every collection the used heap returns to the same 420 MB baseline instead of creeping upwards, and neither the average response time nor the throughput drifts across the hour. The finding is still real, however: the criterion is 2.00 s and some users are being served in about 5 s, so collection behaviour needs tuning.
A messaging platform was tested for four hours at a constant 700 virtual users…
A messaging platform was tested for four hours at a constant 700 virtual users. Each iteration of the script posts several messages and then runs a 'search message history' query, and the test data was not reset at any point during the run. The results show a steady drift within the single run. The average response time of 'search message history' was 0.42 s across the first 20 minutes and 1.18 s across the last 20 minutes, rising smoothly in between. Throughput fell from 210 to 190 transactions per second while the number of virtual users stayed constant. Processor utilisation on the application and database servers remained between 55% and 58% throughout, used heap returned to about 600 MB after every collection, no transaction failed, and no errors were written to the application or database logs. The message table grew from 2.1 million rows at the start of the run to 26.4 million rows at the end, and its index on conversation and timestamp grew in proportion. Which conclusion is best supported by this evidence?
The drift is caused by the data volume growing during the run, so later iterations query a far larger table and index than earlier ones; measurements from the start and the end of the run are therefore not comparable, and the data volume must be reset or pre-seeded to a defined size for results to be reproducible.
Correct. The response time tracks the row count while resources, heap and error counts stay flat, which points at the growing data set rather than at the system's behaviour under load.
The pattern is the classic signature of a memory leak in the search component: response times rise steadily while load is held constant, which is how a leak manifests before it exhausts the available heap.
Incorrect. Used heap returned to about 600 MB after every collection, so memory is being reclaimed; a leak would show a rising post-collection baseline.
The drift shows a resource leak in the database connection pool, since throughput fell by roughly 10% over the run while the applied load remained unchanged at 700 virtual users.
Incorrect. Exhaustion of a connection pool typically produces waits, time-outs or errors in the logs, and none were recorded; the throughput decline follows directly from each transaction taking longer.
The run had not reached steady state until its final 20 minutes, so only that last measurement window represents the system's behaviour and only those figures should be reported as the result.
Incorrect. Load was constant from the outset, so the system was in steady state with respect to load; what changed was the data volume, and declaring the final window authoritative would enshrine one arbitrary table size as the result.
The drift is explained by the volume of data growing during the run: every iteration inserts rows, so a query executed in the fourth hour searches a table and index more than ten times larger than the one searched in the first twenty minutes. Resources are not saturated, the heap is stable and nothing is failing, so no leak or saturation account for the pattern. The practical consequence is that measurements from the start and the end of the run are not comparable with each other, and the run cannot be reproduced unless the data volume is controlled — by resetting the data or by pre-seeding it to a defined size.
The matchmaking service of an online game calls an external entitlement service…
The matchmaking service of an online game calls an external entitlement service on every 'find match' request, to confirm that the player owns the season pass. The entitlement service is operated by another provider and is not available in the test environment, so it has been replaced by a service virtualization stub configured to return a fixed canned response after 5 ms. Production monitoring of the real entitlement service, gathered over the previous season, gives a mean response time of 180 ms, a 90th percentile of 320 ms, and occasional responses of up to 1.5 s during the provider's own peak periods. The test results are: 'find match' average response time 0.34 s, 90th percentile 0.46 s, against an acceptance criterion of 1.00 s; sustained throughput 620 transactions per second; processor utilisation 55%; no failed transactions. Which conclusion is best supported by this evidence?
The results are optimistically biased and cannot show the criterion is met: the stub responds in 5 ms where the real service averages 180 ms and occasionally takes 1.5 s, and the longer wait also holds worker threads and connections open, so response time, concurrency and achievable throughput are all understated. The stub must reproduce the real service's response time distribution.
Correct. A stub that is faster than the component it replaces produces results that flatter the system, and the effect is not a simple additive offset because the waiting also consumes resources.
Because the stub isolates the matchmaking service from its dependency, the figures measure that service's own performance correctly, and the real production response time is obtained by adding the entitlement service's mean of 180 ms to each measurement.
Incorrect. Arithmetic addition ignores that the extra wait occupies threads and connections for the duration; the resulting contention changes throughput and response time by more than the added delay.
The stub makes the test pessimistic rather than optimistic, because a fixed 5 ms canned response cannot benefit from the caching that the real entitlement service performs for repeated lookups of the same player.
Incorrect. The direction of the bias follows from the numbers: 5 ms is far faster than the real service's measured mean of 180 ms, so the test understates response times rather than overstating them.
The results are valid as they stand, since service virtualization is the accepted approach when an external dependency is unavailable and the acceptance criterion applies to the matchmaking service rather than to the provider's entitlement service.
Incorrect. Service virtualization is indeed the accepted approach, but a stub is only useful if its timing behaviour resembles what it replaces; the criterion covers the response a player experiences, which includes the dependency.
The stub answers in 5 ms where the real service averages 180 ms and occasionally takes 1.5 s, so the results are optimistically biased and cannot support a conclusion that the criterion is met. The bias is not merely an offset to be added on afterwards: while a thread waits 180 ms instead of 5 ms it continues to occupy a worker thread and a connection, so the number of concurrent in-flight requests, thread pool occupancy and the achievable throughput are all understated, and the variability of the real service is not represented at all. The stub has to be configured to reproduce the real service's response time distribution, or the test repeated against the real service.
A ride-hailing platform runs its 'Request a ride' transaction on a six-node…
A ride-hailing platform runs its 'Request a ride' transaction on a six-node application server cluster behind a load balancer. A 30-minute steady state was executed at 1 200 virtual users. The acceptance criterion is an average response time of 1.50 s. The charts below show the figures reported per node, and the aggregated cluster-level report produced by the tool for the same run.
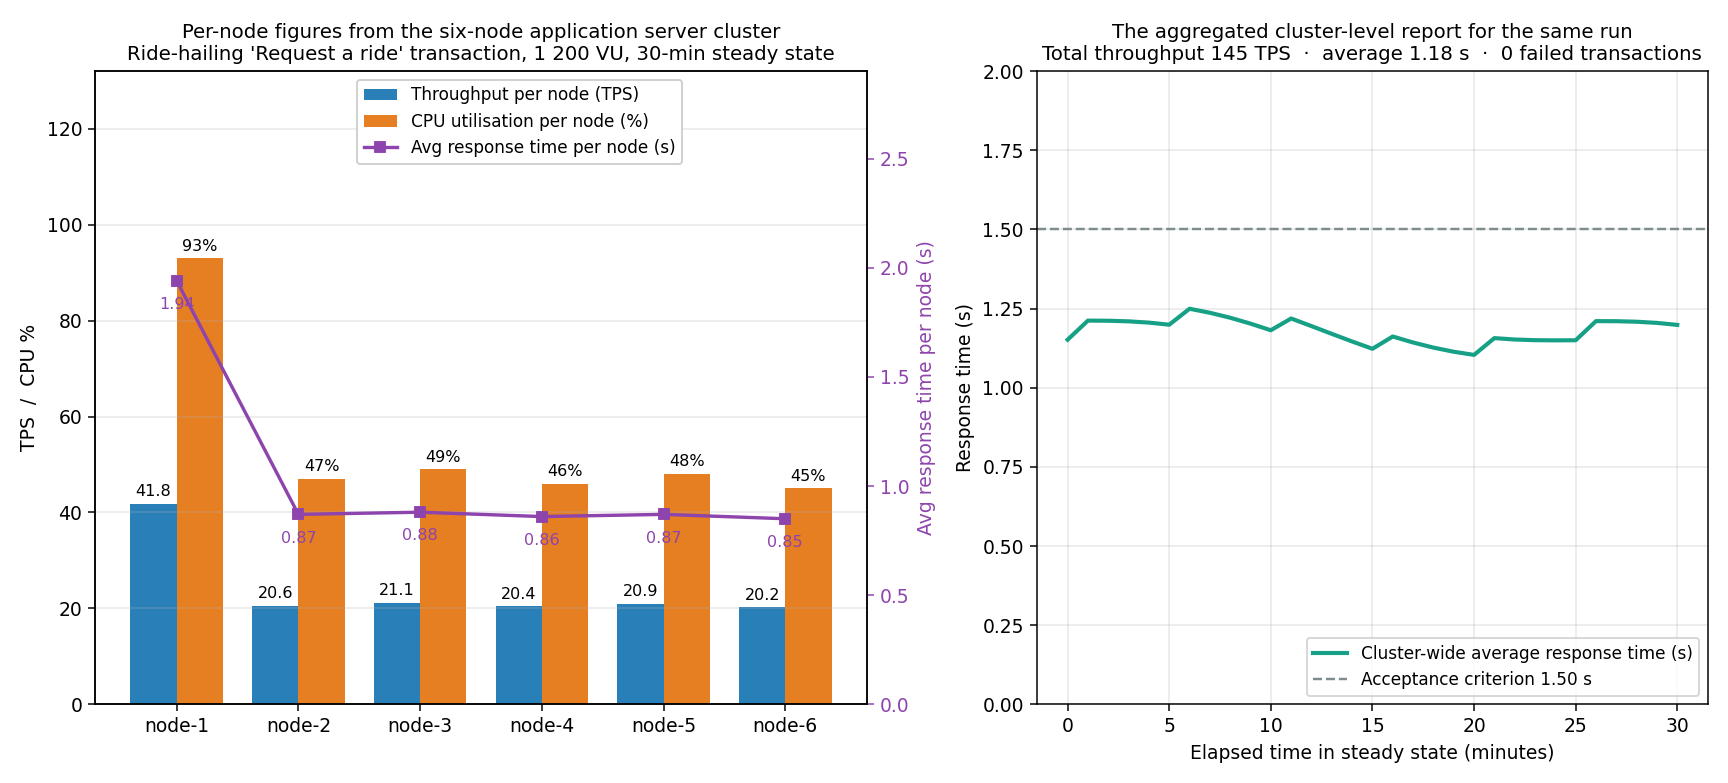
Which conclusion is best supported by this evidence?
Node-1 is receiving roughly twice the share of requests of any other node and is at 93% utilisation with more than double their response time, which the cluster-wide average of 1.18 s conceals; the cluster therefore has much less headroom than the aggregate suggests, and the load-balancing configuration must be investigated before any capacity conclusion is drawn.
Correct. Aggregation across nodes hides an imbalance that determines when the cluster will actually run out of capacity, since the first node to saturate sets that limit.
Since the cluster-wide average of 1.18 s is inside the 1.50 s criterion and no transaction failed, the run passes and the per-node breakdown is informational detail that does not affect the verdict.
Incorrect. A node at 93% utilisation is close to saturation, so the passing aggregate describes a configuration with almost no margin; treating the breakdown as decoration discards the most important finding of the run.
Node-1 must be defective hardware and should be replaced, because six nodes of identical specification receiving identical load would be expected to report identical response times.
Incorrect. Node-1 is not receiving identical load — it handles 41.8 transactions per second against about 20.5 on each of the others — so its slower response is explained by the distribution of work rather than by faulty hardware.
The differences between the nodes lie within the normal variation of a six-node cluster, so the single actionable finding is the 93% utilisation on node-1, which should be addressed by adding processor capacity to that node.
Incorrect. A twofold difference in throughput is not normal variation, and adding capacity to node-1 would treat the symptom while leaving the uneven distribution — and the five under-used nodes — in place.
The aggregated view satisfies the criterion, which is exactly the problem: node-1 is taking roughly twice the share of requests that any other node takes, sits at 93% processor utilisation, and answers more than twice as slowly as its peers, yet averaging across all six nodes dilutes this to 1.18 s. The consequences are that the cluster has far less headroom than the aggregate suggests — node-1 will saturate first, well before the other five — and that any capacity figure extrapolated from this run would be wrong. The load-balancing configuration has to be investigated before the run is used to support any statement about capacity.
Two candidate builds of a national eID authentication service were measured…
Two candidate builds of a national eID authentication service were measured under the same load profile against the same data set. The acceptance criterion currently reads: "the mean response time of the authentication transaction shall be below 1.20 s". The service handles about 3.2 million authentications per day. Build A: mean 0.92 s, 90th percentile 1.20 s, 99th percentile 1.45 s, maximum 1.81 s. Build B: mean 0.92 s, 90th percentile 1.18 s, 99th percentile 4.90 s, maximum 9.60 s. Neither run recorded a failed transaction, and throughput was equal in both. What does this comparison imply for the acceptance criterion?
Neither the mean nor the 90th percentile distinguishes the two builds, yet build B leaves about one authentication in a hundred — roughly 32 000 per day at this volume — taking 4.9 s or more; the criterion must therefore be expressed at a percentile high enough to cover the tail that matters, with the acceptable proportion stated explicitly.
Correct. The comparison shows that the chosen statistic determines what the criterion can detect, and a mean or a 90th percentile is blind to a tail that affects tens of thousands of users a day.
Build B is the better choice, because its 90th percentile is marginally lower than build A's, and the 99th percentile describes rare outliers that should be left out of acceptance criteria as unrepresentative.
Incorrect. At 3.2 million authentications a day, the slowest 1% is about 32 000 users daily, which is neither rare nor unrepresentative in absolute terms.
The identical means demonstrate that the two builds perform equivalently, so the gap at the 99th percentile is measurement noise that would not reappear if both runs were repeated.
Incorrect. A 99th percentile of 4.90 s against 1.45 s, with maxima of 9.60 s against 1.81 s, is far too large and too structured to be noise; equal means simply do not describe the shape of a distribution.
The criterion should be rewritten to require that 100% of authentications complete within 1.20 s, since only a limit that admits no exceptions prevents a tail like build B's from being accepted.
Incorrect. Demanding 100% compliance is not recommended: a single extreme sample from any cause would fail the whole run, which is why criteria are stated at a percentile with an explicit tolerated proportion.
Both builds satisfy a criterion written on the mean, and at the 90th percentile build B even looks marginally better. The divergence appears only at the 99th percentile, where build B leaves roughly one authentication in a hundred taking 4.9 s or more — about 32 000 authentications per day at this volume. A criterion on the mean, and in this case even one on the 90th percentile, cannot distinguish the two builds. The criterion therefore has to be stated at a percentile high enough to cover the part of the distribution stakeholders care about, with the acceptable proportion made explicit.
A live sports streaming platform was tested with a 90-minute run: a 15-minute…
A live sports streaming platform was tested with a 90-minute run: a 15-minute ramp-up from 0 to 2 000 virtual users, a 60-minute steady state at 2 000 users, and a 15-minute ramp-down back to 0. The acceptance criterion is a 90th percentile response time below 2.00 s for the 'open stream' transaction. The report generated by the tool over the whole 90-minute run gives: average 1.05 s, 90th percentile 1.44 s, maximum 3.9 s, throughput 480 transactions per second. An analyst recomputes the same statistics over the 60-minute steady state alone and obtains: average 1.62 s, 90th percentile 2.31 s, maximum 3.9 s, throughput 610 transactions per second. Which conclusion is best supported by this evidence?
The full-run figures are contaminated by ramp-up and ramp-down samples taken at much lower load, which pull the aggregate down; statistics compared against acceptance criteria must be computed over the steady state, where the 90th percentile is 2.31 s and the criterion is therefore not met.
Correct. The higher throughput over the steady state alone confirms that the excluded windows carried less load, so including them understates the response times the intended load actually produces.
Both sets of figures are valid views of the same run, and because the full-run aggregate is computed over a larger number of samples it is the statistically more reliable of the two and should be the one reported.
Incorrect. More samples do not help when the extra samples were gathered under a different load; they make the aggregate describe a workload that was never the subject of the criterion.
The difference shows the system degrading as the run progresses, which is why the steady-state figures are worse: the later part of the run is the slowest part and dominates that subset of the samples.
Incorrect. The later part of the run is the ramp-down, when load and response times were falling. The steady state sits in the middle of the run, so a degradation over time would not produce this pattern.
The steady-state figures are inflated because excluding the ramp-up discards the transient states, and transient states are where mass-login problems appear, so the full-run aggregate remains the correct basis for judging acceptance.
Incorrect. Transient states do matter and are analysed separately, precisely because averaging them together with the steady state misleads; that is an argument for reporting them apart, not for one blended aggregate.
The full-run aggregate includes the ramp-up and the ramp-down, during which far fewer virtual users were active and the system was correspondingly faster. Those low-load samples pull the aggregate down, so the run appears to pass with a 90th percentile of 1.44 s. Statistics compared against acceptance criteria have to be computed over the steady state, where the intended load was actually applied; on that basis the 90th percentile is 2.31 s and the criterion is not met. The higher steady-state throughput figure confirms that the excluded periods were periods of lower load.
Chapter 5 · Tools — 3 questions
A distributed performance test of a messaging platform uses load generators deployed on eight machines across three locations. Which statement correctly describes the role of the load management console as distinct from the role of the load generators?
The generators produce the transaction load against the system under test, while the console is where the scenario is configured, the run is started and stopped across all generators, their execution is kept coordinated, and their measurements are consolidated into one result set.
Correct. The console controls and consolidates; the generators execute. This division is what makes a distributed test manageable as a single run.
The console produces the load for those transactions that require synchronisation between virtual users, while the generators produce the load for the remaining independent transactions.
Incorrect. All load is produced by the generators; the console coordinates them, including at synchronisation points, rather than generating traffic itself.
The console monitors the resource consumption of the system under test, while each generator monitors only its own resource consumption and reports it in a separate result set.
Incorrect. Monitoring the system under test is the role of monitoring tools; the console's defining function is control of the scenario and consolidation of results, including the generators' own measurements.
The console holds the licences and issues them to the generators at run time, which is its sole function, with the scenario configured separately on each generator machine.
Incorrect. Licence handling may sit with the console, but configuring the scenario centrally and consolidating results are its substantive functions; per-generator configuration would make a coordinated distributed run impractical.
The load generators are the components that actually produce the transaction load against the system under test. The load management console is the control point: it is where the scenario is configured, where the run is started and stopped across all generators at once, where the generators are kept coordinated, and where their measurements are collected and consolidated into a single result set for analysis.
When assessing the suitability of a performance test tool, which two of the following considerations belong to the compatibility factor? (Choose two.)
Which protocols the tool can record and generate, and whether they include the protocols the system under test actually uses.
Correct. Protocol support is the first element of compatibility, and a tool that cannot speak the system's protocols cannot test it however capable it is otherwise.
Which interfaces the tool exposes to external components, for example whether it can be invoked by the continuous integration server the project uses, and which platforms it can be installed on.
Correct. Interfaces to external components, continuous integration among them, and supported platforms are the other two elements of the compatibility factor.
How many concurrent virtual users the tool can drive, and how its licences count those users and the machines they run on.
Incorrect. Virtual user counts, licensing and generator machine configuration belong to the scalability factor.
How much technical knowledge the tool requires of the people operating it, given that insufficiently skilled testers can produce incorrect results with it.
Incorrect. This is the understandability factor, which is frequently underestimated when tools are chosen.
Whether the operating system counters the tool gathers can be related to the transaction response times it records, and whether the set of counters can be supplemented.
Incorrect. Sufficiency of measurements, their correlation with transactions and the ability to supplement them make up the monitoring factor.
Compatibility covers the protocols the tool supports, the interfaces it offers to external components — including the continuous integration server that will invoke it — and the platforms on which it can be installed and operated. The number of concurrent virtual users and how licences are counted belong to scalability; the technical knowledge the tool demands belongs to understandability; and whether collected counters can be correlated with transaction times belongs to monitoring.
A team selected a performance test tool for a live sports streaming platform…
A team selected a performance test tool for a live sports streaming platform, and the following emerged during its first substantial use. The tool drives the intended load without difficulty: 3 000 virtual users, complete coverage of the protocols in use, and per-transaction response times reported up to the 99th percentile. It also gathers a rich set of operating system counters from every server at one-second resolution: processor, memory, disk queue length and network bytes. What it does not do is present those counters and the transaction timings on a shared timeline in one view; it exports the two data sets in different formats, with timestamps rounded differently in each. During analysis, the 'open stream' transaction shows a four-minute period of degradation. Somewhere within the same broad window several servers show elevated disk queue lengths and one shows a memory spike, but the team cannot establish which of these actually coincided with the degradation. After two days it abandons the attempt and reports the degradation without a cause. Which tool suitability factor was inadequately assessed, and what is the lesson?
Monitoring. The factor asks not only whether enough measurements are collected but whether they can be correlated with the transaction measurements and supplemented where they fall short, so a tool that gathers a great deal of data can still leave a bottleneck unlocatable.
Correct. Correlating resource counters with transaction times on a common timeline is how the point of degradation is found, and the tool's inability to do so is precisely a monitoring shortcoming.
Scalability. The tool's ability to drive 3 000 virtual users from the machines available is what governs whether the degradation can be reproduced for a second, better instrumented attempt.
Incorrect. The tool drove the required load without difficulty, so scalability was assessed adequately; the failure occurred in analysis rather than in generation.
Compatibility. The two data sets are exported in incompatible formats with inconsistent timestamps, and support for formats and data exchange is what the compatibility factor is concerned with.
Incorrect. Compatibility covers protocols, interfaces to external components and supported platforms. The export format of results is part of how the tool supports monitoring and analysis.
Understandability. The team failed because it lacked the technical knowledge needed to interpret operating system counters such as disk queue length and relate them to application behaviour.
Incorrect. The team knew what to look for and knew which counters mattered; what defeated it was the inability to place those counters on the same timeline as the transactions.
This is the monitoring factor. The question it asks is not only whether the tool collects enough measurements, but whether those measurements can be correlated with the transaction measurements, and whether the set can be supplemented where it falls short. A tool can gather a great deal of data and still leave a bottleneck unlocatable if its counters cannot be aligned with transaction times, because correlating metrics on a common timeline is the technique by which the point of degradation is identified.