ISTQB Specialist (CT-PT) Mock Exam #2 — Questions & Answers
Every question in this mock exam, with the correct answer marked and a written rationale behind each option below — for reading and review, not a timed run.
Chapter 1 · Basic Concepts — 6 questions
A hospital electronic health record (EHR) system is used by three nursing…
A hospital electronic health record (EHR) system is used by three nursing shifts. At 07:00 the outgoing and the incoming shift overlap, and roughly 900 nurses sign in and open their patient lists within the same four-minute window. For the rest of the shift the number of signed-in users is stable and the system behaves acceptably. The test team wants to select the type of performance testing whose specific aim is to evaluate how the system copes with a large number of users carrying out the same operation at the same moment. Which type of performance testing matches that aim most closely?
Concurrency testing, because the risk being examined is many users performing the same operation at the same point in time.
Correct. The syllabus defines concurrency testing exactly this way, and gives mass simultaneous log-on as its typical example. The 900 sign-ins inside four minutes is that situation.
Endurance testing, because the system has to remain available across all three nursing shifts without being restarted.
Incorrect. Endurance testing evaluates whether a system sustains a required load over an extended period, looking for effects such as memory leaks or growing database volumes. Here the concern is a four-minute burst of one operation, not a long duration.
Capacity testing, because the team needs to establish the largest number of nurses the EHR can serve while still meeting its response-time objectives.
Incorrect. Capacity testing determines how much volume or how many users the system can handle while still meeting its performance objectives. That is a useful test here, but it is not the type aimed specifically at the same operation being performed simultaneously.
Scalability testing, because the hospital plans to extend the EHR to two further wards during the next budget year.
Incorrect. Scalability testing establishes whether the system can meet future requirements and which resources would have to be added. The stem describes a load pattern that exists today, not a growth requirement.
Concurrency testing is defined as testing that focuses on many users performing the same operation at the same point in time, which is exactly the 07:00 mass sign-in. The other three types have different aims: endurance looks at a long duration, capacity looks at the maximum volume that can be handled while still meeting objectives, and scalability looks at the ability to meet future requirements by adding resources.
The syllabus identifies a small set of principal approaches by which load can be generated for a performance test. Which of the following is one of those approaches?
Generating load by means of crowds, that is, a large number of real people carrying out agreed operations on the system at an agreed time.
Correct. Load generation via crowds is one of the four principal approaches named in the syllabus, alongside generation through the user interface, through the API and by replaying captured communication protocols.
Generating load by raising the sampling frequency of the monitoring agents installed on the servers under test until their overhead becomes measurable.
Incorrect. Monitoring overhead is the probe effect, which is something to be kept small so that measurement does not distort the system under test. It is a side effect of instrumentation, not a way of generating the workload.
Generating load by replaying the application's audit log into the reporting database while no users are connected to the system.
Incorrect. This describes populating or exercising a database directly. It bypasses the application paths whose performance is under investigation, and it is not one of the load generation approaches listed in the syllabus.
Generating load by executing the existing unit test suite repeatedly inside the continuous integration pipeline until the build duration stabilises.
Incorrect. Running unit tests repeatedly exercises code in a build environment and produces no realistic operational workload. Unit tests with profiling are mentioned as a dynamic performance testing activity, not as a load generation approach.
The four principal approaches to load generation named in the syllabus are: through the user interface, by means of crowds, through the application programming interface, and by replaying captured communication protocols. Increasing monitoring frequency, replaying audit logs into a reporting database and re-running a unit test suite are not load generation approaches in this sense.
During a stress test of an airline check-in service the system does not simply…
During a stress test of an airline check-in service the system does not simply become slower. At roughly 130% of the expected peak load, passengers begin to receive raw server error pages, a proportion of seat-assignment requests is discarded without any message, and some sessions are terminated mid-transaction. The team classifies the observation as the failure mode 'inadequate error handling at or beyond the limits of capacity'. Which causes does the syllabus typically associate with that failure mode? (Choose all that apply.)
Resource pools, such as the pool of database connections available to the check-in application, sized too small for the load being offered.
Correct. Insufficient resource pools are named in the syllabus as a cause of ungraceful error handling once the system is pushed to its limits: once the pool is exhausted, requests fail rather than queue politely.
Queues or stacks that are too small to hold the requests waiting to be served, so that arriving requests are discarded once the structure is full.
Correct. Queues and stacks that are too small are listed as a cause: when they overflow, work is dropped instead of being handled, which is precisely the silent discarding of seat-assignment requests described.
Time-out values configured so short that a request is abandoned while the server is still legitimately working on it.
Correct. Time-outs that are too fast are named in the syllabus as a cause of this failure mode, and they explain terminated sessions and error pages appearing under load while the server is in fact still processing.
Progressive fragmentation of the disk storage used by the check-in database as the system stays in operation over a period of weeks.
Incorrect. Disk fragmentation is one of the causes the syllabus lists under a different failure mode, namely degradation of performance over time, together with memory leaks and a growing database. It does not explain errors appearing at a specific load level.
A reporting query whose execution plan was optimised for a data volume considerably larger than the volume currently held in the check-in database.
Incorrect. A query plan tuned for the wrong data volume is an ordinary tuning problem that would show up as slow response at any load level. It is not among the causes the syllabus associates with error handling breaking down at the limits of capacity.
Inadequate error handling at the limits of capacity is associated with insufficient resource pools, queues or stacks that are too small for the offered load, and time-out values that are set too short. Disk fragmentation over weeks of operation belongs to the 'degradation over time' failure mode, and a query plan tuned for a different data volume is an ordinary tuning issue rather than a limit-of-capacity error handling cause.
An electricity utility currently ingests telemetry from 1.2 million smart…
An electricity utility currently ingests telemetry from 1.2 million smart meters, each sending a reading every 15 minutes. A regulatory programme will extend the roll-out to 5 million meters over the next 18 months, with the same reading interval. Management asks the test team to establish whether the existing ingestion platform can be brought up to that volume, and which resources would have to be added to get there. Which type of performance testing directly addresses the question management has asked?
Scalability testing, because the question is whether future volume requirements can be met and which resources would have to be added to meet them.
Correct. The syllabus describes scalability testing as focused on the ability of a system to meet future efficiency requirements, which may exceed those currently required, and on identifying what needs to be added or changed.
Capacity testing, because the platform must be characterised against the largest meter population it can currently ingest while still meeting its objectives.
Incorrect. Capacity testing establishes the maximum volume the system can handle in its present configuration. That figure is a useful input, but it does not tell management what would have to be added to reach five million meters.
Load testing, because the ingestion platform must be exercised at realistic and increasing levels of expected meter traffic to confirm its behaviour.
Incorrect. Load testing evaluates behaviour under anticipated levels of load, including varying and increasing load. It characterises the current system rather than answering a question about a future volume requirement and the resources needed for it.
Stress testing, because the platform must be driven beyond its anticipated peak meter traffic to observe how and when it starts to fail.
Incorrect. Stress testing evaluates behaviour at and above the limits of anticipated load or capacity, including recovery afterwards. Useful, but it is about failure behaviour rather than about the resources needed for planned growth.
Scalability testing is aimed at determining whether the system can meet future requirements and what has to change (added hardware, added instances, configuration) to achieve them. Load, stress and capacity testing all characterise the system as it exists now rather than answering what must be added to reach a future volume.
A national tax authority operates an online income declaration service. Filing…
A national tax authority operates an online income declaration service. Filing is spread over four months, but in the final 48 hours before the statutory deadline the service receives around three times its normal peak submission rate. The test team is asked to establish how the service behaves when it is driven beyond its anticipated peak, at what point it stops meeting its objectives, and whether it returns to normal operation once the excess load falls away. Which type of performance testing corresponds to that objective?
Stress testing, because the service is to be driven at and above its anticipated peak so that its behaviour at the limit and its recovery afterwards can be observed.
Correct. The syllabus characterises stress testing as focusing on the system's ability to handle peak loads at or beyond the limits of its anticipated or specified workloads, and it includes the ability to recover once the load reduces.
Spike testing, because the deadline creates a sudden burst of submissions that appears and disappears within a very short interval.
Incorrect. Spike testing addresses the ability to respond to sudden bursts of very large change in load, typically over seconds or minutes. The stem describes an elevated rate sustained across 48 hours and asks explicitly about the limit and recovery, which is the stress objective.
Endurance testing, because the elevated submission rate lasts for two full days and the service must not degrade while it continues.
Incorrect. Endurance testing evaluates whether a system can sustain a required load continuously over a long period, looking for degradation such as memory leaks. The stated objective here is the behaviour beyond the anticipated peak and the recovery from it.
Concurrency testing, because a large number of taxpayers submit their declarations in the same hours of the final day.
Incorrect. Concurrency testing focuses on many users performing the same operation at the same moment, for example a mass simultaneous log-on. The objective in the stem is about exceeding the anticipated peak, not about simultaneity of one operation.
Testing at and beyond the anticipated limits of load or capacity, including how the system recovers afterwards, is stress testing. Spike testing concerns sudden short bursts of very large change in load, endurance concerns sustained load over a long period, and concurrency concerns many users performing the same operation simultaneously.
A test manager at a university is reviewing a draft performance test approach for the course enrolment system against the principles of performance testing described in the syllabus. Which of the statements below are consistent with those principles? (Choose all that apply.)
The tests should be aligned with the expectations of the stakeholders who will act on the results, so that the measurements answer the questions those stakeholders actually have.
Correct. Alignment with stakeholder expectations is the first of the principles listed in the syllabus: a technically flawless test that answers nobody's question fails on this principle.
Results should be reproducible, so that repeating the same test under the same conditions yields statistically comparable measurements.
Correct. Reproducibility is named explicitly as a principle. Without it a difference between two runs cannot be attributed to a change in the system rather than to variation in the test.
The tests may be conducted on a complete system or on individual components and sub-systems, depending on which parts are available to test.
Correct. The syllabus states that performance tests may be performed on complete or partial systems, including individual components and sub-systems, which is what makes early performance work feasible.
The approach should be designed on its technical merits first and costed afterwards, leaving the available budget and schedule to be reconciled with it as a separate project decision.
Incorrect. One of the principles is that the tests must be achievable within the constraints of the project, including budget and time, so those constraints shape the approach while it is being designed rather than being reconciled with it afterwards.
Comparability is best served by reporting the arithmetic mean response time for each transaction and omitting percentile figures, so that stakeholders compare one number per run.
Incorrect. The principle asks for results that are understandable and comparable, which the syllabus supports with aggregation including percentiles; the mean alone hides the distribution and is the very figure the syllabus warns can mislead.
The principles include: performance tests must be aligned with the expectations of the stakeholders who will act on the results; results must be reproducible under the same conditions; results must be understandable and comparable; tests may be run on a complete system or on individual components and sub-systems; and the tests must be achievable within the available budget and time. Treating budget and schedule as something to be settled after the approach is fixed, or reporting a mean and dropping percentiles, both work against those principles.
Chapter 2 · Performance Measurement Fundamentals — 4 questions
A government permit-issuing system has been in development for two years and no performance measurements have been collected at any point. Which of the following is one of the project risks that the syllabus associates with the absence of performance measurement?
There is no baseline, so the performance effect of a later change cannot be judged against a known earlier state and trends over time remain invisible.
Correct. The absence of a baseline, and with it the inability to see trends or to attribute a change in performance to a specific modification, is one of the risks listed in the syllabus.
Static testing techniques such as reviewing the database schema and the entity-relationship diagrams can no longer be applied to the system.
Incorrect. Static performance testing activities, including reviews of requirements, database schemas, entity-relationship diagrams and critical code sections, remain available regardless of whether dynamic measurements were ever collected.
The functional test cases lose their traceability to the requirements from which they were derived, because the requirements were never measured.
Incorrect. Traceability between functional test cases and requirements is a configuration and test management concern; it is unaffected by whether performance metrics were gathered.
Response times measured after release will be dominated by client-side rendering rather than by server-side processing, making later measurement meaningless.
Incorrect. The relative contribution of client-side rendering to end-to-end response time depends on the application design, not on whether measurements were taken earlier. Later measurement remains meaningful, it simply has nothing to be compared with.
One of the risks named in the syllabus is that without measurements there is no baseline, so trends cannot be seen and the performance effect of a later change cannot be judged against a known earlier state. The other options describe consequences that do not follow from a lack of performance measurement.
A 45-minute performance test of a smart-meter telemetry ingestion service…
A 45-minute performance test of a smart-meter telemetry ingestion service produced about 6.8 million individual measurement records, one per ingested reading. A stakeholder asks the test team to supply the full list of individual response times so that the result can be assessed. What is the main reason the syllabus gives for aggregating performance test results instead of presenting the individual measurements?
Individual measurements are too numerous to interpret; aggregating them per transaction into figures such as minimum, maximum, average and percentile makes trends and outliers visible.
Correct. This is the reason the syllabus gives for aggregating results: the raw volume of measurements has to be reduced to figures a reader can reason about and compare, per transaction type.
Aggregation reduces the probe effect, because fewer values have to be written to the results repository while the test is running.
Incorrect. The probe effect concerns how measurement instrumentation influences the system under test during the run. Aggregation is normally performed on data already collected and does not address it; reducing the probe effect means collecting less or less intrusively.
Aggregation is required so that the raw measurement values may be discarded before the performance test report is issued to stakeholders.
Incorrect. Aggregation is done for interpretability. Retaining raw data is often valuable for later re-analysis and for comparison with a baseline, so aggregation is not a licence to discard it.
Aggregation converts client-side measurements into server-side measurements, which is the viewpoint the acceptance criteria are written against.
Incorrect. Aggregation is arithmetic performed on measurements; it cannot change where they were taken. The distinction between a protocol-level and a user-interface-level measurement comes from the script, not from how results are summarised.
Individual measurements are far too numerous to interpret directly. Aggregation into meaningful figures per transaction, such as averages, minima, maxima and percentiles, is what makes trends, outliers and comparisons across runs visible. The other options misattribute aggregation to the probe effect, to data retention, or to a change of measurement viewpoint.
During enrolment week at a university, the 'add course to timetable' transaction…
During enrolment week at a university, the 'add course to timetable' transaction is measured at an average response time of 11.4 seconds against a stated target of 3 seconds. At the same time, CPU utilisation stays below 55% on both the application and the database server, memory utilisation stays below 60%, and no monitored resource exceeds 75%. A developer concludes from the resource figures that the system has no performance problem. Which statement best describes this situation in the terms used by the syllabus?
Resource figures on their own can mislead: utilisation well below saturation is compatible with response times an order of magnitude worse than the target, so the response-time result stands and the cause must be sought elsewhere, for example in waiting on a serialising resource.
Correct. This is the situation the syllabus uses as its illustration of misleading raw numbers, and it is why measured response time against the stated target is not dismissed on the strength of utilisation readings.
Performance testing has an unambiguous test oracle in the resource utilisation figures, so the utilisation reading is the deciding result and the response-time reading should be treated as indicative only.
Incorrect. The syllabus states that performance testing typically has no clear test oracle, and it certainly does not promote utilisation to that role. Utilisation is one input among several, not the arbiter.
Because the 3-second target was established with a single user on the system, an elevenfold response time under enrolment-week load is the expected consequence of concurrency and needs no further analysis.
Incorrect. Nothing in the stem says the target applies only to single-user conditions, and treating any degradation under load as expected removes the purpose of having an acceptance criterion. The gap is a finding that requires analysis.
The measurement should be set aside, since a response time can be meaningfully compared with its target only once at least one monitored resource has reached 75% utilisation.
Incorrect. No such precondition exists. The 75% figure appears in the syllabus only as part of an example showing that low utilisation and unacceptable response times can occur together, not as a validity threshold for measurements.
The syllabus warns explicitly that raw performance figures can mislead, and gives the example of resource utilisation below 75% coexisting with response times an order of magnitude worse than required. Performance testing usually has no clear-cut test oracle, so the response-time result is not overruled by comfortable utilisation figures; the cause is sought elsewhere, typically in waiting on a serialising resource.
A telecom operator is deciding which sources of performance metrics to use for its billing and top-up platform. One of the candidate sources is a performance monitoring tool. Which statements about performance monitoring tools, as described in the syllabus, are correct? (Choose all that apply.)
They may be deployed on the live production platform and not only in the test environment, so that performance is observed after release as well as before it.
Correct. The syllabus notes that performance monitoring tools are used in production as well as in test environments, which is what makes post-release performance observation possible.
They can raise alerts when defined thresholds are crossed, and can help recognise patterns such as a denial-of-service or distributed denial-of-service attack.
Correct. Alerting on thresholds and recognising attack patterns including DoS and DDoS are given in the syllabus as capabilities of performance monitoring tools.
They complement the measurements produced by the performance test tool itself, which observes the platform from the outside rather than from within its components.
Correct. The syllabus treats performance test tools, monitoring tools and log analysis tools as complementary sources; the monitoring tool supplies the internal resource view the load generator cannot see.
They obtain their measurements chiefly by parsing the platform's log files for events such as deadlocks, SQL exceptions and time-outs, which is their defining characteristic.
Incorrect. That description belongs to log analysis tools, which the syllabus lists as a separate source of performance metrics. Monitoring tools sample resource and application counters rather than mine logs for those events.
Their sampling runs at a low enough priority that its influence on the behaviour of the platform being measured can be treated as negligible when the results are interpreted.
Incorrect. Monitoring frequently runs on the servers under test and consumes their resources, and verbose or frequent collection can be substantial. The syllabus warns about exactly this as the probe effect, so the influence is assessed rather than assumed away.
Performance monitoring tools may be used on the live production system as well as in test environments, can raise alerts when defined thresholds are crossed and help recognise patterns such as denial-of-service attacks, and they complement the performance test tool, which observes the system from the outside. Parsing log files for deadlocks, SQL exceptions and time-outs is the role of log analysis tools, and monitoring is not exempt from the probe effect.
Chapter 3 · Performance Testing in the Software Lifecycle — 7 questions
A government agency issues building permits through a system built as three…
A government agency issues building permits through a system built as three separate tiers: a web tier that serves the citizen portal, an application tier that runs the permit workflow rules, and a database tier that holds applications and documents. Each tier runs on its own set of servers. Which performance risk is characteristic of this architecture category as described in the syllabus?
Each tier, and each communication path between tiers, is a candidate bottleneck, so a limitation in a single tier shows up as degraded response time for the whole business transaction.
Correct. The syllabus treats multi-tier architectures as carrying the risk that performance in any one tier, and in the traffic between tiers, constrains the end-to-end transaction, which is why each tier has to be monitored separately.
The system competes for constrained device resources such as battery charge, working memory and sensor availability, which vary with the physical situation of the user.
Incorrect. Constrained device resources, battery, memory, temperature and sensors are the risks the syllabus assigns to mobile applications, not to a server-side multi-tier deployment.
Automatic provisioning of additional capacity may be governed by scaling rules that are configured incorrectly, so capacity is added too late or not at all.
Incorrect. Self-scaling and misconfigured scaling rules are the characteristic risk of dynamic or cloud-based architectures. Nothing in the stem indicates that capacity is provisioned automatically.
Behaviour under load has historically been highly predictable, but the workload profile changes once the system is opened up through application programming interfaces and web services.
Incorrect. That description matches the mainframe category in the syllabus: traditionally predictable systems whose load profile becomes less predictable once exposed through APIs and web services.
In a multi-tier architecture each tier and each communication path between tiers is a potential bottleneck, and a limitation in one tier propagates as slow response for the whole business transaction. This is the category-specific risk. Battery, memory and sensor constraints belong to mobile applications, incorrect self-scaling rules belong to dynamic or cloud-based architectures, and predictable behaviour now exposed through service interfaces belongs to mainframe systems.
An airline offers self check-in through a browser application that passengers…
An airline offers self check-in through a browser application that passengers use from their own devices over airport and hotel wireless networks, and through kiosks in the terminal that connect over the airport's shared network. The server side is unchanged between the two channels, yet the test team expects noticeably different performance results. Which set of risks does the syllabus associate with this client-server situation?
Risks arising from the connection itself: the speed available to the client, congestion on shared and public wireless networks, and the effect of firewalls, packet inspection and load balancing on the traffic.
Correct. These are precisely the client-server risks listed in the syllabus, and they explain why an unchanged server side can still produce very different measured performance for different client channels.
Risks arising from strict timing deadlines in the client software, where predictable worst-case reaction time matters more than the average and a missed deadline is a safety concern.
Incorrect. Hard timing deadlines and safety criticality are the risks the syllabus associates with embedded real-time systems. A browser-based check-in page has no such deadline semantics.
Risks arising from gradual degradation while the system stays in operation, caused by memory that is never released, fragmenting storage and a database that keeps growing.
Incorrect. These are the causes of the 'degradation over time' failure mode, which is investigated with endurance testing. They are not specific to the client-server relationship the stem describes.
Risks arising from the division of responsibility with the software supplier, where the acquiring organisation carries the whole burden of performance verification.
Incorrect. That is the supplier and acquirer situation the syllabus describes for commercial off-the-shelf software. The stem is about two client channels of a system the airline already operates.
For client-server architectures the syllabus names risks arising from the connection between client and server: connection speed, network congestion, public wireless access, firewalls, packet inspection and load balancing. The other options describe risks the syllabus assigns to embedded real-time systems, to endurance-related degradation, and to the acquirer role for commercial off-the-shelf software.
A logistics company is starting performance testing of a warehouse management…
A logistics company is starting performance testing of a warehouse management system used with handheld barcode scanners. The picking process, the put-away process and the stock-count process each consist of partly overlapping steps: log on, scan a location, confirm a quantity, print a label. The test analyst is deciding how to organise the design of the performance test cases. Which approach to performance test design does the syllabus recommend for a situation like this?
Design the test cases modularly, so that each covers a reusable step or short sequence and the modules can then be combined into the different operational and load profiles.
Correct. The syllabus describes performance test cases as modular building blocks precisely so that shared steps are built once and assembled into the various profiles rather than duplicated per process.
Design one end-to-end test case per warehouse process, each covering the process from log on to label printing, so that every case can be run and reported on its own.
Incorrect. Self-contained end-to-end cases duplicate the shared steps in three places and make it harder to recombine them into new profiles. The syllabus favours modular building blocks over this arrangement.
Derive the performance test cases from the functional test cases with the highest requirements coverage, so that the performance test inherits the coverage already achieved functionally.
Incorrect. Requirements coverage of functional tests does not indicate which operations dominate the workload. Performance test cases are driven by operational profiles and performance risks, not by inherited functional coverage.
Postpone design and simply record several scanner sessions with the load generation tool, since the recorded scripts will document the steps that need to be covered.
Incorrect. Recording produces scripts, not a design, and recorded scripts still require parameterisation and correlation before they are usable. Deferring design also leaves the choice of profiles unexamined.
The syllabus recommends designing performance test cases in a modular way, so that the individual test cases act as building blocks that can be combined into larger operational and load profiles. The other options describe an end-to-end monolithic design, a functional-coverage-driven design, and a record-only approach, none of which is what the syllabus advises.
A university is preparing performance testing of its course enrolment system in line with the ISTQB test process. The team has finished test planning and is now in the test analysis activity. Which work belongs to the test analysis activity for performance testing according to the syllabus?
Examining the test basis, which for performance testing includes the performance requirements, the service level agreements, the IT architecture and any capacity planning information available.
Correct. The syllabus names exactly this material as the basis analysed during performance test analysis, since it is what performance test conditions and risks are derived from.
Selecting the load generation tool, obtaining the required licences and installing the load generators and management console in the test environment.
Incorrect. Tool selection is decided during planning and the tooling is set up during implementation. It is not the analysis of the test basis.
Building the enrolment scripts, parameterising the student identifiers and correlating the session values returned by the server so that the scripts replay correctly.
Incorrect. Scripting, parameterisation and correlation are implementation activities. Analysis precedes them and determines what has to be scripted at all.
Watching the run until the system reaches steady state and confirming that the virtual user status shows no failures before the measurements are taken as valid.
Incorrect. Observing steady state and checking virtual user status are part of test execution and of analysing results, not part of analysing the test basis.
In test analysis for performance testing, the test basis is examined: performance requirements, service level agreements, the IT architecture and capacity planning information, so that performance test conditions and risks can be identified. Selecting and installing tools belongs to planning and implementation, building and parameterising scripts belongs to implementation, and watching for steady state belongs to execution.
A utility ingests smart-meter telemetry through a distributed architecture…
A utility ingests smart-meter telemetry through a distributed architecture: collection nodes in eight regions forward readings to a central processing cluster, which calls an external tariff service operated by a third party and writes to a shared storage service. Processing of a reading therefore crosses several networks and several independently operated components. Which performance risks does the syllabus associate with a distributed architecture of this kind? (Choose all that apply.)
Communication across networks between the distributed components becomes part of the end-to-end response time, so latency between regions and the central cluster has to be measured and monitored.
Correct. Because a distributed architecture places processing on separate machines, the network paths joining them contribute directly to response time and are a recognised risk area for this category.
The component that saturates first limits the throughput of the whole chain, so the ingestion rate can be capped by one node while the others still have spare capacity.
Correct. In a distributed chain the constraining component determines overall throughput, which is why per-component monitoring is needed rather than a single aggregate figure.
Components operated by a third party, such as the external tariff service, contribute to response time although the utility can neither tune them nor load-test them freely.
Correct. Dependence on components outside the organisation's control is a genuine risk in distributed architectures, and it is one reason the syllabus discusses stubs and service virtualisation for such interfaces.
Available battery charge, device temperature and sensor availability on the meter constrain how quickly a reading can be produced and dispatched.
Incorrect. Battery, temperature and sensor constraints are the risks the syllabus lists for mobile applications. They are not the distributed-architecture risks the question asks about.
Every reading has a hard deadline whose violation is treated as a safety failure, so the worst case rather than the average determines whether the system is acceptable.
Incorrect. Hard deadlines with safety consequences characterise embedded real-time systems in the syllabus. A telemetry ingestion pipeline has throughput and latency objectives, not safety deadlines of that kind.
Distributed architectures spread processing across components connected by networks, so network communication between the parts becomes part of the response time, the slowest or most heavily loaded component limits the whole chain, and components outside the organisation's control must still be accounted for even though they cannot be tuned. Sensor and battery constraints belong to mobile applications, and hard safety deadlines belong to embedded real-time systems.
The performance test environment for a hospital EHR system consists of three…
The performance test environment for a hospital EHR system consists of three virtual machines (web, application, database) hosted on a shared hypervisor host that the hospital's IT department also uses for virtual machines belonging to other departments. The same test, with an identical script set, identical test data and an identical load profile of 500 virtual users, was executed twice: - Run A, Tuesday 02:00. Average 'open patient record' response time 1.2 s, 90th percentile 1.5 s. CPU utilisation reported inside the guest virtual machines: 41% application, 33% database. - Run B, Wednesday 14:00. Average 'open patient record' response time 3.1 s, 90th percentile 6.9 s. CPU utilisation reported inside the guest virtual machines: 41% application, 34% database. After the second run, the IT department supplied host-level figures that the test team had not collected before: CPU ready time on the host was 0.4% during Run A and 22% during Run B, and the host reclaimed memory from the guests through ballooning during Run B only. What is the most defensible analysis of these results?
The difference is explained by contention for host resources shared with other workloads on the same hypervisor: guest counters report only the resource the virtual machine was actually granted, so host ready time and ballooning have to be collected and the contention isolated or accounted for before results from this environment are comparable.
Correct. Ready time of 22% and memory reclamation during Run B, with unchanged guest CPU, is the signature of a virtualised environment competing with neighbouring workloads. The syllabus lists this among virtualisation risks, and reproducibility cannot be claimed until it is controlled or at least measured.
The application has a memory leak that developed between the two runs: memory reclaimed by the host on Wednesday indicates that the application server was holding memory it no longer needed, which explains the slower response times.
Incorrect. Ballooning is the hypervisor taking memory back from guests because the host is under memory pressure; it says nothing about a guest process failing to release memory. A leak would also show as degradation within a run, which the data does not show.
Data volume growth between Tuesday and Wednesday is the likely cause: the database accumulated a day of additional records, so queries had more rows to scan, which raised the 90th percentile disproportionately.
Incorrect. The stem states that identical test data was used, and database guest CPU is essentially unchanged at 33% and 34%, which is not what additional scanning work would look like. This explanation also ignores the host figures entirely.
The results show that the EHR system does not scale beyond roughly 500 virtual users, so the next step is to repeat the test with a lower load profile in order to establish the point at which the 90th percentile begins to rise.
Incorrect. Both runs used the same 500 virtual users and produced very different results, which is evidence about the environment rather than about a scaling limit of the system. Searching for a knee point in an environment that is not yet reproducible would produce numbers that cannot be trusted.
The guest-level counters look identical across both runs because a virtual machine only reports the CPU it was actually given; the ready time and ballooning figures show that during Run B the virtual machines spent a substantial share of the time waiting for host resources that were being consumed by other workloads on the same hypervisor. This is the characteristic risk of a virtualised environment, and it breaks the reproducibility principle: until host-level contention is measured and either isolated or accounted for, results from this environment cannot be compared or attributed to the EHR system.
A smart electricity meter contains embedded firmware that must react to a…
A smart electricity meter contains embedded firmware that must react to a load-disconnect command from the grid operator. The specification states a hard deadline: the disconnect relay has to be actuated no later than 50 ms after the command is received, because a late actuation can leave a fault current flowing. The component is classified as safety related. A performance test of the firmware issued 200,000 disconnect commands under a representative mix of background activity. Results: - average actuation time 12 ms - 90th percentile 18 ms - 99th percentile 31 ms - maximum 240 ms, with 94 commands (0.047%) exceeding 50 ms - all 94 slow actuations occurred while the firmware was writing its event journal to flash memory The supplier proposes to report the result as a pass, on the grounds that the average and the 90th percentile are comfortably inside the deadline and the exceedances are a rounding error in percentage terms. Which analysis of these results is the most appropriate?
The result is a failure against the specified deadline: for a safety-related real-time component the worst case governs the verdict, and the observed correlation with flash journal writes gives a concrete cause to investigate and remove rather than to average away.
Correct. The syllabus treats embedded real-time systems as a category where safety criticality and predictable timing dominate, so a hard deadline that is missed 94 times is a finding, and the journal-write correlation is exactly the kind of lead that analysis should pursue.
The result is a pass, because 0.047% of actuations outside the deadline is well within the tolerance normally applied to performance acceptance criteria, where insisting on complete conformance is discouraged.
Incorrect. The guidance that 100% conformance is usually not required concerns response-time criteria for interactive business transactions. It does not transfer to a hard deadline whose violation has a safety consequence.
The 90th percentile is the figure the syllabus recommends for reporting transaction response time, so the verdict should rest on the 18 ms value and the maximum should be recorded as an observation only.
Incorrect. The 90th percentile is the customary reporting figure for transaction response time, but choosing it here would discard precisely the data that decides the safety question. The reporting convention does not override the acceptance criterion.
No verdict can be given yet: the test should be repeated with the background activity removed, since figures obtained while other firmware activity competes for the processor are not comparable against a timing specification.
Incorrect. The deadline has to hold under representative conditions, so removing the background activity would remove the very conditions under which the violations arise. A quiet-system measurement would understate the risk rather than validate it.
For an embedded real-time, safety-related component the acceptance question is whether the deadline can be missed at all, so the worst case governs the verdict rather than the average or a percentile. Ninety-four actuations beyond 50 ms are deadline violations, and the correlation with flash journal writes identifies a concrete, addressable cause. Reporting a pass on average behaviour would hide a safety-relevant defect behind an aggregate the syllabus already warns can mislead.
Chapter 4 · Performance Testing Tasks — 20 questions
While planning performance testing for a hospital EHR system, the test manager…
While planning performance testing for a hospital EHR system, the test manager collects two statements of intent. The clinical director says: 'a nurse must be able to open a patient record and see the medication list without waiting long enough to lose the thread of the conversation with the patient'. The infrastructure architect says: 'the database server must stay below 70% CPU utilisation at peak so that the nightly reporting job still fits in its window'. How are these two objectives classified in the syllabus, and what follows for the test plan?
The first is a user-based objective and the second a technical objective; both belong in the plan, and each needs its own metrics because a satisfied technical objective does not by itself demonstrate a satisfied user objective.
Correct. The syllabus draws exactly this distinction between user-based and technical performance test objectives, and keeping both is what prevents a test from reporting comfortable server metrics while the clinical experience is unacceptable.
Both are technical objectives, since each can ultimately be expressed as a measurement taken from a server-side counter; the difference is only in the wording chosen by each stakeholder.
Incorrect. The classification follows the perspective the objective is written from, not whether some counter can be found. A user-based objective describes the experience of using the system and is measured end to end.
The first is a user-based objective and the second is a service level agreement; service level agreements are recorded in the contract rather than in the performance test plan.
Incorrect. A utilisation ceiling stated by the architect is a technical performance test objective. Service level agreements are separate input to test analysis, and where they exist they are still reflected in the plan rather than kept out of it.
Only the second is a usable performance test objective, because the first is not quantified and unquantified statements are excluded from the performance test plan.
Incorrect. An imprecise user-based objective is a reason to go back to the stakeholder and quantify it, which is what the questions to stakeholders in the planning activity are for. Discarding it would drop the objective the system exists to satisfy.
The syllabus distinguishes user-based performance test objectives, expressed from the perspective of the user's experience of the system, from technical performance test objectives, expressed in terms of the behaviour of the technical components. Both belong in the plan, they are measured with different metrics, and neither replaces the other.
A telecom operator's billing portal is being load tested. The business sponsor…
A telecom operator's billing portal is being load tested. The business sponsor states the requirement as '500 concurrent subscribers must be supported'. The test analyst points out that this statement does not yet define a load, and gives two candidate interpretations: 500 subscribers each submitting one balance enquiry per minute, and 500 subscribers each submitting one balance enquiry per hour. What does this example illustrate about specifying load, according to the syllabus?
Load is determined by throughput, the rate at which operations arrive, so the two interpretations differ by a factor of 60 and a user count alone does not specify a load.
Correct. This is the syllabus example: the same number of users at one request per minute versus one request per hour represents a sixtyfold difference in load, which is why throughput rather than user count defines the workload.
The number of concurrent users is the primary specification of load; the request rate is a secondary detail that the load generation tool derives from the recorded session.
Incorrect. This reverses the relationship. A tool can only derive a rate from a recording if the recorded think times happen to match real behaviour, which is an assumption rather than a specification.
The ambiguity disappears once the response time target is agreed, because the response time determines how many requests each subscriber is able to submit within an hour.
Incorrect. Response time influences how quickly a user can complete an operation, but it does not establish how often a subscriber chooses to check a balance. The arrival rate comes from the operational profile, not from the target.
Both interpretations describe the same load, since the same 500 sessions are open on the server in either case and the sessions are what consume server resources.
Incorrect. Open sessions consume some resources, but the work the system performs is driven by the requests arriving through them. Sixty times more enquiries per hour is sixty times more work regardless of the session count.
The syllabus makes the point with this very contrast: the two interpretations differ by a factor of 60 in the load actually offered to the system. Load is determined by throughput, that is by the rate at which operations arrive, and not by the number of users on its own. The number of virtual users is a means of generating a throughput, not a specification of it.
A government permit portal is tested with a load generation tool configured to…
A government permit portal is tested with a load generation tool configured to hold 800 virtual users, each of which submits a request, waits for the response, applies a think time and then submits the next request. A colleague argues that the test therefore reproduces a public service where citizens arrive independently of how fast the portal happens to be responding. What distinction does the syllabus draw here, and what is its practical consequence?
A fixed set of virtual users that each wait for a response models a closed system, in which slower responses automatically reduce the offered throughput; an open system, where arrivals are independent of current response time, keeps offering work and builds queues, so the closed model can understate degradation.
Correct. This is the closed versus open system distinction in the syllabus. The self-throttling behaviour of a closed model is exactly why a public-facing service whose arrivals are externally driven should not be assumed to behave like it.
The distinction concerns where the load is generated from: a closed system generates load inside the organisation's own network, while an open system generates it from public points of presence on the internet.
Incorrect. That is the question of load generation topology and points of presence, which is a separate matter discussed under tool scalability and test environment. Closed and open refer to how arrivals relate to the system's own response time.
The distinction concerns the script structure: a closed system is scripted with an initialisation and clean-up section, whereas an open system is scripted with only a repeatable main section.
Incorrect. Initialisation, repeatable main body and clean-up are the standard sections of any performance script. They have no bearing on whether arrivals depend on the system's current response time.
The distinction is immaterial for measurement, because in both models the reported transaction response time is measured from request submission to response receipt for each individual request.
Incorrect. The measurement definition is indeed the same, but the load the system is subjected to is not, so the response times obtained differ. Treating the distinction as immaterial is what leads to a test that is milder than reality.
A load generator holding a fixed number of virtual users that each wait for a response before continuing models a closed system: as the system slows down, each virtual user issues fewer requests, so the offered throughput falls with degradation. A public portal where arrivals do not depend on current response time behaves as an open system, in which requests continue to arrive and queues build. Choosing the wrong model understates the effect of degradation.
The hospital EHR system calls an external laboratory results service operated by…
The hospital EHR system calls an external laboratory results service operated by a regional partner. The partner permits functional connections from the test environment but will not accept load traffic, and its own response time varies between 200 ms and 4 s depending on the partner's daily batch schedule. What approach does the syllabus describe for handling an interface of this kind during performance testing, and what does the team have to keep in mind?
Replace the partner service with a stub or virtualised service configured to reproduce its response characteristics, while recording that the measured results depend on the assumed behaviour of the substitute rather than on the real service.
Correct. Stubs and service virtualisation are the syllabus answer for interfaces that cannot be load tested, and the syllabus is explicit that the emulated timing has to be representative, which makes it an assumption that belongs in the report as a risk.
Exclude every transaction that touches the laboratory interface from the performance test, and cover those transactions only in the functional test where a single real connection is enough.
Incorrect. Removing the interface removes a substantial part of the clinical workload and any queueing it causes inside the EHR. The point of a stub is to keep the transaction in the test rather than to drop it.
Configure the stub to respond immediately with a fixed minimal delay, since a fast substitute isolates the EHR's own processing and produces the cleanest measurement of it.
Incorrect. An unrealistically fast substitute removes the waiting that real calls impose, so threads, connections and queues inside the EHR behave differently than they will in production. The substitute has to represent the real timing, including its slower states.
Record a real interaction with the partner service once and replay the captured protocol traffic to the partner during the load test, so that the partner's real behaviour is exercised without new test data.
Incorrect. Replaying captured traffic still sends load to the partner, which the stem states is not permitted, and correlation would break in any case. The captured-protocol technique concerns how load is generated against a system under test, not how to bypass a refusal.
The syllabus discusses stubs and service virtualisation for components that are unavailable, cannot be load tested or are outside the organisation's control. The substitute has to be configured with response characteristics that represent the real service, and the results have to be read with the awareness that the substitute is not the real component, so any conclusion about the interface itself remains provisional.
A tax authority must decide how to deploy the load generation capability for…
A tax authority must decide how to deploy the load generation capability for testing its online declaration service before the filing deadline. Three options are on the table: load generators installed in the authority's own internal test laboratory, load generators the authority installs on rented cloud infrastructure, and a load testing service consumed as software as a service. Which statements about these deployment options are consistent with the syllabus? (Choose all that apply.)
An internal laboratory gives the authority the most control over the configuration and the network path, but the load it can generate is limited by the hardware the authority owns and can dedicate to testing.
Correct. The syllabus presents the internal laboratory as the controlled but capacity-bounded option, which is why scaling beyond it is one of the reasons to consider cloud-based generation.
Cloud infrastructure allows generation capacity to be added as required and load to be produced from several points of presence, while introducing dependence on network paths the authority does not control.
Correct. Elastic capacity and multiple points of presence are the stated advantages of cloud-based generation, and the loss of control over the intervening network is the corresponding trade-off.
A load testing service consumed as software as a service takes the installation and maintenance of the tooling off the authority's hands, but the tooling and often the test data then reside outside the authority's own environment.
Correct. The syllabus lists software-as-a-service load testing as a deployment option, and for a tax authority handling declaration data the location of that data is a real consideration alongside the reduced maintenance effort.
With a cloud-based option the operational profiles can be left to the service provider, which derives the workload mix from the traffic it observes against the target system during the run.
Incorrect. Operational profiles are derived by the test team from personas, interviews and production logs regardless of where the generators run. A provider observing traffic during a test would only see the load the team itself defined.
Generating the load from the public internet makes the measured response times directly comparable with production figures, because the traffic then follows the same path as a citizen's traffic.
Incorrect. Similar path is not the same path, and performance remains a non-linear function of the environment. Generating from outside improves realism for network-related aspects but does not by itself make test figures interchangeable with production ones.
An internal laboratory gives control over the environment but its capacity is bounded by the hardware the organisation owns. Cloud infrastructure lets the organisation add generation capacity and generate from several points of presence, at the cost of dependence on a network path it does not own. A software-as-a-service load testing offering removes the installation and maintenance effort but places the tooling and often the test data outside the organisation, which raises data protection questions. Operational profiles remain the test team's own work whichever option is chosen, and generating from the internet does not by itself make results equivalent to production.
To reach the load required for the smart-meter ingestion test, the utility will…
To reach the load required for the smart-meter ingestion test, the utility will drive traffic from six load generator machines placed in three locations. The lead performance tester is writing down the practices that apply to a distributed load generation setup of this kind. Which practices does the syllabus describe for such a setup? (Choose all that apply.)
The load generators have to be monitored themselves during the run, since a saturated generator caps the load actually delivered and distorts the response times it reports.
Correct. The syllabus states explicitly that distributed load generators need to be monitored, because their own resource exhaustion is a common source of invalid results.
Network conditions experienced by real clients, such as reduced bandwidth and added latency, can be emulated so that the generated traffic resembles traffic from real locations.
Correct. Network emulation is named in the syllabus as part of preparing the test environment, and it is what makes traffic from a well-connected generator resemble traffic from a constrained real client.
Requests can be made to appear as though they originate from many different network addresses through IP spoofing, which matters when the system or its load balancer treats requests from one address differently.
Correct. IP spoofing is described in the syllabus as a technique used in load generation, and its purpose is exactly to avoid the whole load appearing to come from a handful of source addresses.
Once generation is distributed across several locations, think times may be omitted from the scripts, because the spread of network latencies between locations produces the same spacing between requests.
Incorrect. Network latency differences are measured in milliseconds while think times represent human pauses of seconds; the one cannot substitute for the other. Removing think times changes the offered throughput and the realism of the load.
Resource monitoring should be concentrated on the ingestion platform rather than on the generators, since the generators execute scripts and therefore have a predictable and stable resource footprint.
Incorrect. A generator's footprint grows with the number of virtual users and with the volume of results it records, and it is not predictable in advance. Leaving generators unmonitored is precisely the omission the syllabus warns about.
Distributed load generators are themselves resources that can saturate, so they must be monitored during the run. Network conditions of the real users can be emulated so that the generated traffic resembles what real clients experience. IP spoofing is described as a technique for making requests appear to come from many different addresses, which matters where the system under test or its load balancer treats a source address specially. Placing generators outside the organisation does not remove the need to represent realistic think times, and it is the generators rather than the system under test whose own resource consumption is being watched here.
The warehouse management system exchanges data with a transport planning system…
The warehouse management system exchanges data with a transport planning system and with a customs declaration system. Consignment records leave the warehouse system into a message queue, are picked up by transport planning at intervals, and are forwarded to customs in nightly batches. What does the syllabus say about constructing operational profiles for an arrangement of this kind?
The profile has to account for the buffers and queues between the systems, because work accumulates and is then released in bursts, so the load a downstream system sees is shaped by queue contents and batch timing rather than by an interactive user rate.
Correct. The syllabus treats operational profiles for batch systems and systems of systems as a distinct case, and names buffers and queues as what has to be considered when building them.
Operational profiles apply to interactive user behaviour only, so the batch and queue-driven exchanges should be excluded from the profiles and covered by a separate functional interface test.
Incorrect. The syllabus explicitly extends operational profiles to batch processing and to systems of systems. Excluding them would leave the nightly customs window, one of the heaviest workloads, entirely untested for performance.
Each participating system should be profiled in isolation with an even arrival rate, because an even rate is the conservative assumption and it makes the results of the three systems comparable with one another.
Incorrect. An even arrival rate is the opposite of conservative here: it removes the bursts that queue release produces, and bursts are what expose the downstream capacity limits. Comparability is not a reason to test an unrealistic pattern.
The profile should be derived from the message queue's configured maximum depth, since that value defines the largest amount of work the downstream systems can ever be asked to process.
Incorrect. Queue depth is a capacity limit of the queue, not a description of how work arrives over time. A profile built from it would describe one extreme situation rather than the operational behaviour the syllabus asks to be constructed.
For batch processing and for systems of systems the syllabus points out that the profile must take account of buffers and queues between the participating systems: work does not flow at a constant user-driven rate but accumulates and is then released, so the profile has to reflect the accumulation and the timing of the batch windows rather than only interactive user behaviour.
During execution of an airline check-in performance test, measurements come from…
During execution of an airline check-in performance test, measurements come from three sources: the load management console on the generators, the resource monitors on the application and database servers, and the application's own transaction log. The team intends to correlate a response-time peak with a resource event on the servers. Which precaution does the syllabus specify for the execution activity so that this correlation is possible?
The clocks of all tools and systems taking part in the test must be synchronised, so that events recorded by different tools can be placed on one common timeline during analysis.
Correct. Time synchronisation across the tools involved is named in the syllabus as a requirement of the execution activity, precisely because correlating metrics from different sources is how the cause of a peak is found.
All measurements should be routed into the load management console, since only figures collected by the load generation tool itself can be correlated with the transactions it executed.
Incorrect. Server-side resource metrics normally come from monitoring tools rather than from the load generator, and the syllabus treats them as complementary sources. Correlation is achieved through a common timeline, not through a single collector.
Monitoring should be sampled at the highest frequency the tools allow, because a coarse sampling interval is the usual reason a resource event cannot be matched with a response-time peak.
Incorrect. Sampling frequency has to be balanced against the probe effect, and a fine interval on unsynchronised clocks still produces data that cannot be aligned. Frequency is a tuning decision, not the precaution the syllabus names here.
Measurements should be taken only from the transient state at the start of the run, since that is the period in which resource events and response-time peaks occur close enough together to be related.
Incorrect. The main focus of execution is the steady state; transient states matter for specific cases such as mass log-on and spike tests. Restricting measurement to the ramp-up would discard the bulk of the run.
The syllabus states that the clocks of all tools and systems involved in the test have to be synchronised, because analysis consists largely of aligning events recorded by different tools on a common timeline. Without synchronised time, a resource spike cannot be reliably attributed to the response-time peak it caused.
The results of a load test against the government permit portal include a…
The results of a load test against the government permit portal include a breakdown of responses by HTTP response code. Alongside a large number of 200 codes, the run recorded a substantial share of 302 and 304 codes and a small number of 404 codes. How should these codes be read during analysis of the results?
The 302 redirections and 304 not-modified responses are normal but represent less server work than a full 200 response, so they affect how throughput figures are read, while the 404 responses point at requests for resources that were not found and should be investigated.
Correct. This is how the syllabus uses the response-code breakdown: it distinguishes genuinely served work from redirects and cache validations, and it surfaces errors that the response-time averages would otherwise hide.
Any response code other than 200 should be counted as a failed transaction, so the virtual user pass rate must be recalculated with the 302, 304 and 404 responses all treated as failures.
Incorrect. Redirections and not-modified responses are part of normal web behaviour and are not failures. Reclassifying them would understate the pass rate and obscure the 404 responses, which are the codes that do warrant attention.
The response-code breakdown belongs to functional testing rather than to performance analysis, so it should be passed to the functional team and left out of the performance report.
Incorrect. Response by HTTP response code appears in the syllabus among the metrics collected and analysed in a performance test, because error and redirect volumes change the meaning of the throughput and response-time figures.
A high proportion of 304 responses shows that the load generator is caching content locally, so the caching behaviour of the tool has to be disabled before the throughput figures can be used.
Incorrect. A 304 is the server's answer to a conditional request, indicating the resource has not changed; it reflects the client-server caching protocol rather than the tool silently serving content to itself. Disabling this behaviour would make the traffic less like a real browser.
The syllabus lists response by HTTP response code as one of the metrics to be analysed, and mentions 200, 302, 304 and 404 specifically. A 200 indicates a served request, 302 a redirection, 304 that the resource was not modified and may be taken from cache, and 404 that a resource was not found. A 404 is a defect indication worth investigating; 302 and 304 are normal but affect how much work was actually performed, so they belong in the interpretation of throughput figures.
An analyst has a complete result set from a load test of the university course…
An analyst has a complete result set from a load test of the university course enrolment system: transaction response times over time, transactions per second, hits per second, network throughput, and resource utilisation for every server in the chain. The 'add course' response time is acceptable for the first part of the run and unacceptable later. What does the syllabus describe as the purpose of correlating these different metrics with one another?
To locate the point at which performance starts to degrade and to identify which component or resource the degradation coincides with, since response time alone shows that behaviour worsened but not where the cause lies.
Correct. The syllabus presents correlation of metrics as the technique for finding the degradation point and the associated resource, which is the step between observing a symptom and forming a recommendation.
To compute a single composite performance index from the individual metrics, so that successive runs can be compared against one another using one figure per run.
Incorrect. The syllabus does not propose collapsing metrics into a composite index, and doing so would destroy the very relationships between metrics that correlation exists to reveal.
To verify that the load generation tool recorded its measurements accurately, by confirming that hits per second and network throughput are consistent with the number of transactions reported.
Incorrect. Cross-checking related counters is a reasonable sanity check, but it is not the purpose the syllabus assigns to correlation, which is diagnostic: finding where and when degradation sets in.
To replace the resource utilisation figures with response-time figures in the report, since stakeholders act on response time and correlation shows that the two convey the same information.
Incorrect. Correlation frequently shows the opposite, that acceptable utilisation coexists with unacceptable response time. The two metrics are addressed to different stakeholders and neither substitutes for the other.
The syllabus describes correlation of metrics as the means of locating the point at which performance begins to degrade and of identifying which resource or component is associated with that degradation. Response time alone tells you that something got worse; correlating it against throughput and resource metrics on a common timeline indicates where to look.
A telecom operator wants its top-up service to be tested at a target throughput…
A telecom operator wants its top-up service to be tested at a target throughput of 90 completed top-up transactions per second. The load generator licence and the test environment allow 540 virtual users to be held in the steady state, and the team intends to use all of them. Measurements from a single-user calibration run show that one top-up transaction takes 2.0 seconds of transaction response time from submitting the request to receiving the confirmation. The scripts were recorded from a real agent session and currently carry a think time of 12 seconds between transactions; at that setting the run delivers far less than the required throughput. Using the relationship between system throughput, the number of virtual users, processing time and think time given in the syllabus, what think time must be configured so that 540 virtual users deliver 90 transactions per second?
4.0 seconds, because 540 divided by 90 gives a cycle of 6.0 seconds per virtual user, from which the 2.0 seconds of processing time has to be subtracted.
Correct. Throughput = users / (processing + think), so think = 540/90 - 2.0 = 4.0 s. Each virtual user then completes one transaction every 6 seconds and 540 users deliver 90 per second.
6.0 seconds, because 540 virtual users divided by the target of 90 transactions per second gives the think time that each virtual user has to apply between transactions.
Incorrect. 540/90 = 6.0 s is the whole cycle time per virtual user, which contains both the processing time and the think time. Using it as the think time gives a cycle of 8 seconds and a throughput of only 67.5 transactions per second.
10.0 seconds, because the recorded think time of 12 seconds has to be reduced by the 2.0 seconds of processing time that the transaction itself already occupies.
Incorrect. This subtracts the processing time from the recorded think time, which has no relation to the target throughput. A 12-second cycle would deliver 540/12 = 45 transactions per second, half of what is required.
2.0 seconds, because the think time should match the transaction response time so that each virtual user spends half of its cycle waiting and half of it transacting.
Incorrect. There is no such rule, and the resulting 4-second cycle would deliver 540/4 = 135 transactions per second, overshooting the target by 50% and testing a load nobody asked for.
The syllabus gives system throughput = number of virtual users / (processing time + think time). Rearranged for think time: think time = (virtual users / throughput) - processing time = (540 / 90) - 2.0 = 6.0 - 2.0 = 4.0 seconds. With the recorded 12-second think time the same 540 virtual users deliver only 540 / 14 = about 38.6 transactions per second, which is why the think time has to be adjusted to hit the target throughput.
A utility runs a nightly batch that validates and stores the day's smart-meter…
A utility runs a nightly batch that validates and stores the day's smart-meter readings. The operations agreement states that the batch must complete inside a fixed window from 03:00 to 06:00, because the settlement system reads the results at 06:00 and the meter concentrators start uploading the next day's data shortly afterwards. On a normal day the batch has to process 5,400,000 readings. In a performance test on the target hardware the batch sustained a rate of 420 readings per second, measured in the steady state over 40 minutes. What throughput does the batch require, and what does the measured rate mean for the window?
500 readings per second are required (5,400,000 over 10,800 seconds); at 420 per second the batch would take about 3 hours 34 minutes and would overrun the window by roughly half an hour.
Correct. 5,400,000/10,800 = 500 per second, and 5,400,000/420 = 12,857 seconds, that is 3 h 34 min. The shortfall of 80 readings per second translates into an overrun that pushes the settlement read past 06:00.
1,500 readings per second are required, because 5,400,000 readings have to be divided by the 3,600 seconds available, so the measured rate falls short by a very wide margin.
Incorrect. 3,600 seconds is one hour, but the window is three hours, that is 10,800 seconds. The error triples the requirement and would lead the team to reject hardware that is in fact only 16% short.
500 readings per second are required, and the measured 420 per second satisfies the window, because throughput figures are averages and the readings still in the queue at 06:00 are processed immediately afterwards.
Incorrect. The arithmetic of the requirement is right but the conclusion is not: the window exists because the settlement system reads results at 06:00 and the next upload starts after it. Readings completed after the window are exactly what the agreement excludes.
About 83 readings per second are required, because the 5,400,000 readings may be spread across the 18 hours that separate two consecutive nightly windows, which the measured rate exceeds comfortably.
Incorrect. This uses the interval between windows rather than the window itself. The batch may only run between 03:00 and 06:00, so the 18-hour figure describes time in which the batch is not permitted to run at all.
The window is 3 hours = 10,800 seconds. The required rate is 5,400,000 / 10,800 = 500 readings per second. The measured 420 readings per second is 80 per second short, so the batch would need 5,400,000 / 420 = 12,857 seconds, which is about 3 hours 34 minutes and overruns the window by roughly half an hour. Batch processing time is one of the technical metrics the syllabus lists, and this is the calculation that turns a window into a throughput requirement.
An airline is load testing the seat map of its check-in application. The…
An airline is load testing the seat map of its check-in application. The business transaction 'display seat map and select a seat' is scripted as one timed transaction, and the network trace shows that it consists of 12 HTTP requests: the seat map document, a stylesheet, two scripts, seven cabin images and the seat reservation call. In the steady state the test sustains 45 of these transactions per second. Measurement of the traffic shows that one complete transaction transfers 250 kilobytes in total, counting all 12 requests and their responses. For the purpose of the calculation, take 1 kilobyte as 1,000 bytes, one byte as 8 bits and 1 megabit per second as 1,000,000 bits per second. What hits per second and what network throughput should the report state for this transaction?
540 hits per second and about 90 Mbit/s of network throughput.
Correct. 45 x 12 = 540 hits per second, and 45 x 250 kB = 11,250 kB/s = 11,250,000 bytes/s, which multiplied by 8 gives 90,000,000 bit/s = 90 Mbit/s.
540 hits per second and about 11.25 Mbit/s of network throughput.
Incorrect. The hits figure is right, but 11,250 kilobytes per second has been reported as if kilobytes were kilobits. Converting bytes to bits requires multiplication by 8, which gives 90 Mbit/s rather than 11.25.
45 hits per second and about 90 Mbit/s of network throughput.
Incorrect. The throughput is right but the hits figure equates hits with business transactions. A hit is an individual HTTP request, and each transaction issues 12 of them, so the correct figure is twelve times larger.
6,480 hits per second and about 90 Mbit/s of network throughput.
Incorrect. 6,480 is 540 multiplied by 12 a second time. The 12 requests per transaction are applied once to the 45 transactions per second, giving 540 hits per second.
Hits per second counts individual HTTP requests, not business transactions: 45 transactions per second x 12 requests = 540 hits per second. Network throughput is 45 x 250 kilobytes = 11,250 kilobytes per second = 11,250,000 bytes per second; multiplied by 8 that is 90,000,000 bits per second, i.e. 90 Mbit/s. The syllabus lists hits per second and throughput in bits per second as separate metrics precisely because a transaction count does not reveal either of them.
The acceptance criterion for the tax authority's declaration service states…
The acceptance criterion for the tax authority's declaration service states: 'the 90th percentile of the response time of the submit declaration transaction shall not exceed 4.0 seconds'. A deadline-day load test recorded 2,400 successful submit declaration transactions. Sorted into ascending order, the sample includes the following values: - 1st value: 0.7 s - 2,159th value: 3.6 s - 2,160th value: 3.7 s - 2,161st value: 4.6 s - 2,400th value (maximum): 31.2 s - arithmetic mean of all 2,400 values: 2.1 s Which value in this ordered sample corresponds to the 90th percentile, and what verdict does the criterion produce?
The 2,160th value, 3.7 s, so the criterion is met; the remaining 240 submissions may still be much slower, up to the 31.2 s maximum, and that tail belongs in the report alongside the percentile.
Correct. 0.90 x 2,400 = 2,160, and the 2,160th value of 3.7 s is inside the 4.0 s limit. The percentile deliberately excludes the slowest 10%, so the maximum is reported next to it rather than instead of it.
The 2,161st value, 4.6 s, because the 90th percentile is the first value above which no more than 10% of the measurements remain, so the criterion is missed by 0.6 s.
Incorrect. The position is 0.90 x 2,400 = 2,160, and 240 values remain above it, which is exactly 10%. Taking the next value up moves the boundary inside the slowest 10% and turns a passing result into a failing one.
The 90th value in the ordered list, because the 90th percentile is by definition the ninetieth measurement counted upwards from the fastest one recorded.
Incorrect. A percentile is a proportion of the sample, not an absolute position. The 90th of 2,400 values sits in the fastest 4% of the sample and would report a figure far better than the service actually delivered.
The maximum of 31.2 s, since a percentile criterion is treated as met when the slowest measurement in the sample is inside the stated limit, which gives a verdict of failed by 27.2 s.
Incorrect. That reading turns the percentile into a maximum and makes the choice of 90 meaningless. The syllabus notes that demanding conformance from every measurement is not recommended; the maximum is reported as supporting information beside the percentile.
With 2,400 ordered values, the 90th percentile is located at 0.90 x 2,400 = the 2,160th value, which is 3.7 s. That is below the 4.0 s limit, so the criterion is met: 90% of submissions completed in 3.7 s or less. The remaining 10%, that is 240 submissions, may be considerably slower, up to the 31.2 s maximum, and the syllabus advises reporting that tail rather than letting the percentile hide it. Requiring every single measurement to be within the limit is explicitly not recommended.
A telecom operator load tested its prepaid top-up service in six steps of 200…
A telecom operator load tested its prepaid top-up service in six steps of 200 virtual users, holding each step in the steady state for 15 minutes. The measured results were as follows.
Throughput rose from 95 transactions per second at 200 virtual users to 275 at 600, and then stayed flat at about 288 to 290 transactions per second for 800, 1000 and 1200 virtual users. Over the same steps the average transaction response time rose from 1.0 s to 1.1 s, then to 2.2 s, 3.6 s, 5.1 s and 6.7 s.
Resource metrics: application server CPU utilisation reached 41% at 600 virtual users and did not exceed 44% thereafter; database server CPU utilisation stayed between 31% and 32%; memory utilisation on both servers stayed below 55% and disk I/O rate remained well below the device limit. The application server's database connection pool is configured with a maximum of 50 connections; the number of connections in use reached 50 at the 600 virtual user step and remained at 50 for every later step, while the average time a request waited to acquire a connection from the pool grew from 0.05 s at 400 virtual users to 0.9 s, 2.3 s, 3.8 s and 5.4 s.
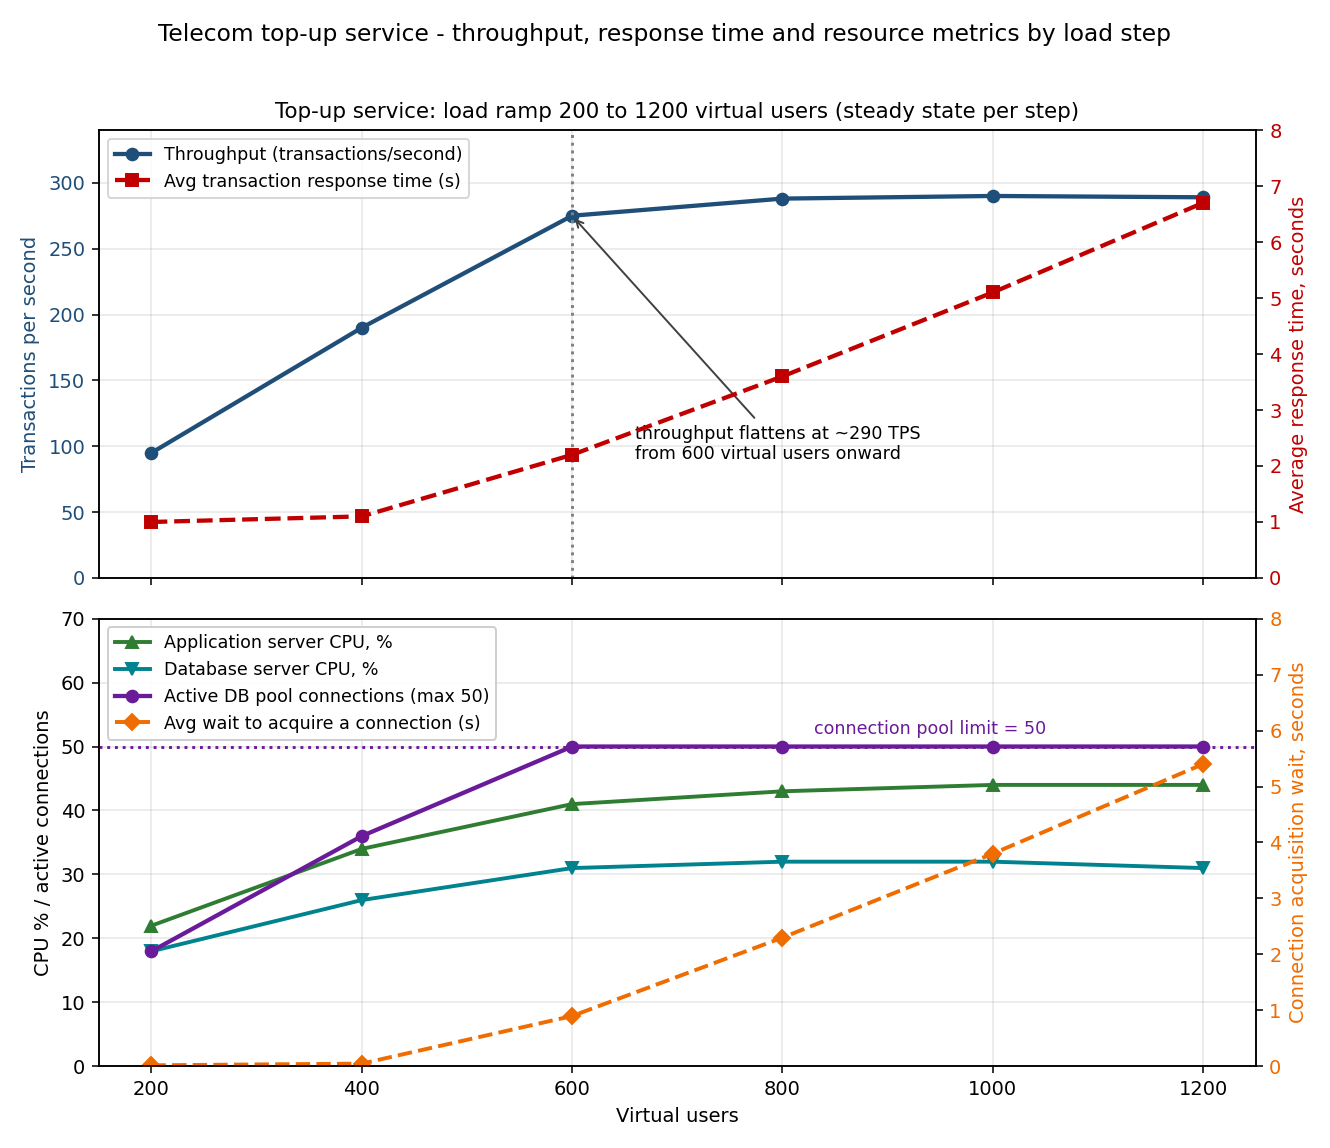
Which conclusion do these results support, and what should the recommendation be?
The database connection pool is the constraining resource: it is pegged at its configured maximum of 50 from the 600 virtual user step onwards, and the growing wait to acquire a connection accounts for almost all of the added response time while both CPUs stay under 45%. The recommendation is to raise the pool size and verify that the database can support the larger pool.
Correct. Flat throughput with linearly rising response time indicates a saturated resource, and the pool is the only metric that reaches its limit. At 1200 virtual users the 5.4 s connection wait accounts for most of the 6.7 s response time, which ties the symptom to the cause.
The application server has reached its processing limit, since throughput stops growing at the point where its CPU utilisation stops growing. The recommendation is to add application server instances behind the load balancer so that more CPU capacity becomes available to the top-up transaction.
Incorrect. The application server CPU stops at 44%, which leaves more than half of its capacity unused, so it is not the limit. Adding instances would multiply the demand on the same 50-connection pool per instance and could make the contention worse rather than better.
The service has reached its natural capacity of about 290 transactions per second, since no monitored resource exceeds 75% utilisation and no further throughput can be obtained. The recommendation is to record 290 transactions per second as the capacity figure and set the acceptance criteria accordingly.
Incorrect. Utilisation below 75% coexisting with unacceptable response time is exactly the misleading raw figure the syllabus warns about. A configured pool limit is a setting, not a natural capacity, so accepting 290 transactions per second would enshrine a tuning defect as a requirement.
The results indicate a load generation problem, because a genuine bottleneck would show as rising utilisation on at least one server. The recommendation is to add load generators and repeat the ramp before drawing any conclusion about the top-up service itself.
Incorrect. A saturated generator caps throughput but would not produce a connection pool sitting at its maximum with a rising acquisition wait measured inside the application. The pool and wait metrics come from the system under test and point at it, not at the generators.
Throughput reaching a ceiling while response time continues to grow in proportion to the added virtual users is the signature of a saturated resource. Because both CPUs and memory stay modest and disk I/O is low, the constraining resource is not raw hardware: the connection pool is pegged at its configured maximum of 50 from the 600 virtual user step onwards, and the connection acquisition wait accounts for almost the whole increase in response time (5.4 s of the 6.7 s at 1200 users). Correlating the metrics in this way is what the syllabus describes as locating the degradation point and the resource associated with it; the pool size, and the database's ability to serve a larger pool, are what the recommendation has to address.
A hospital EHR system was tested with a constant load of 400 virtual users held…
A hospital EHR system was tested with a constant load of 400 virtual users held for 60 minutes after a short ramp-up. The number of virtual users did not change during the hour and the mix of transactions stayed the same throughout. The acceptance criterion for the 'save clinical note' transaction is an average response time of at most 2.0 seconds.
Measurements taken every 10 minutes: the average response time of 'save clinical note' rose from 0.9 s at the start of the hour to 1.1 s, 1.7 s, 2.8 s, 3.8 s, 4.2 s and 4.4 s at minute 60. Over the same period the write I/O rate on the database volume rose from 2,100 to 3,200, 4,200, 4,850, 4,950, 4,960 and 4,950 operations per second against a provisioned device limit of 5,000, and the average disk queue length rose from 0.6 to 14.1. CPU user time on the database server stayed between 30% and 32% for the whole hour, while the share of CPU time spent waiting for I/O rose from 4% to 39%. Java heap occupancy after garbage collection was stable at 1,050 to 1,120 MB throughout, and no errors were reported by the virtual users.
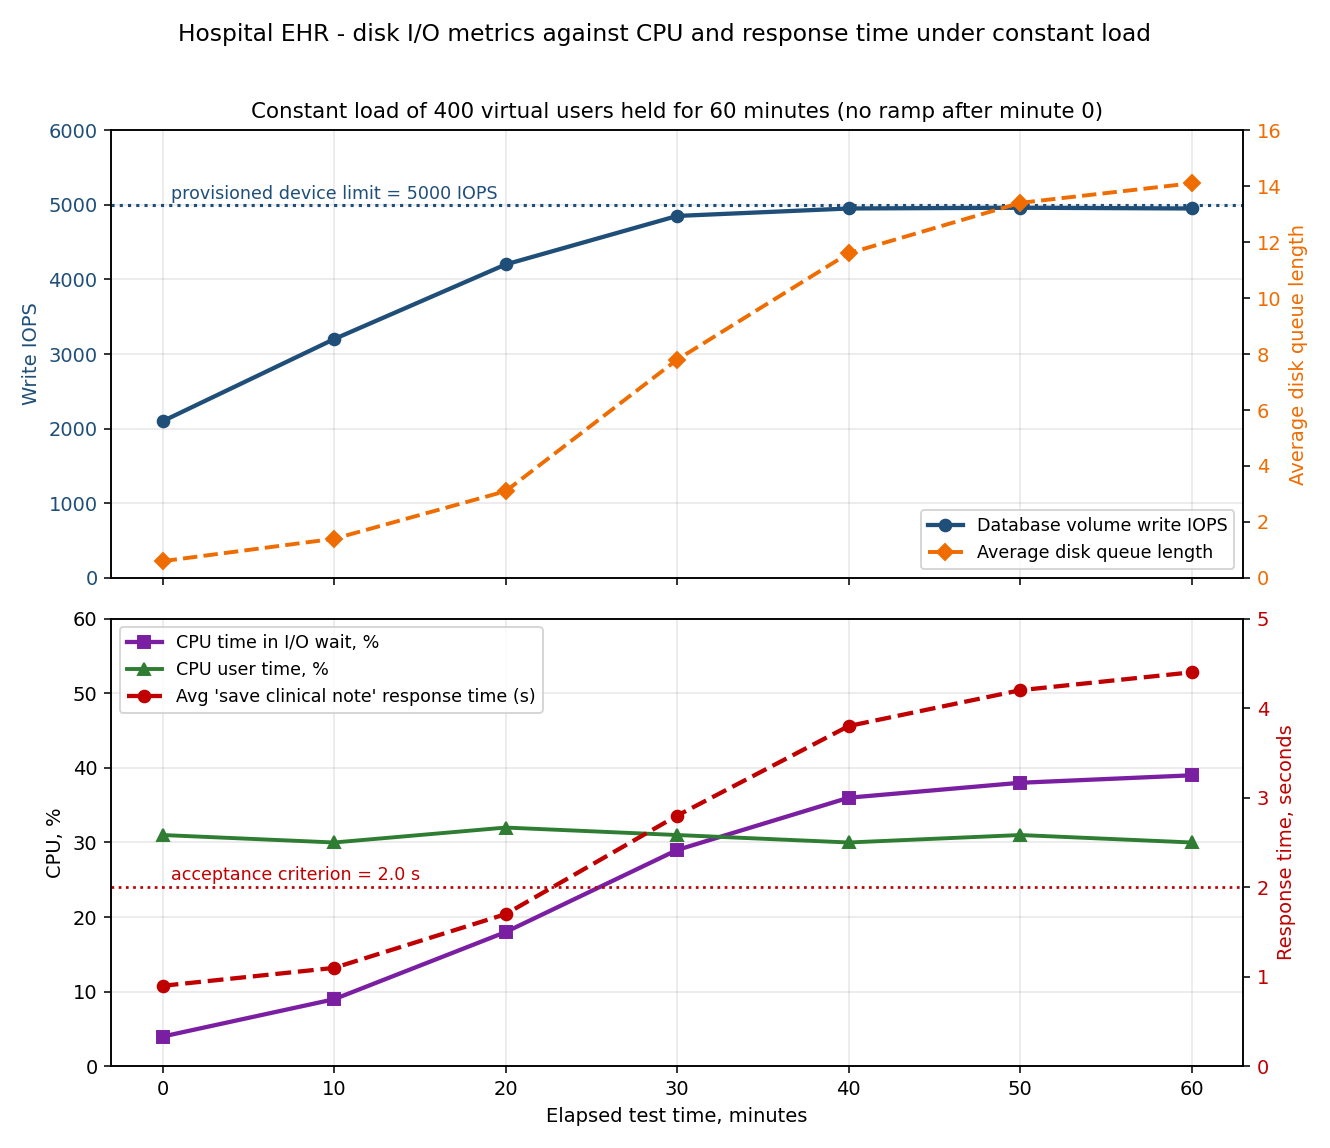
Which conclusion is best supported by this data set?
The storage subsystem is saturated: the write I/O rate has flattened just below the provisioned device limit, the disk queue is growing and the CPU increasingly waits for I/O while user CPU stays flat, so requests are queueing for the device rather than for processor time.
Correct. A flattening I/O rate at the device limit, a growing queue length and rising I/O wait against flat user CPU together identify the disk subsystem as the constrained resource, and they explain response time growth under an unchanged load.
The application is leaking memory: response time degrading steadily under an unchanged load over an hour is the classic signature of memory that is not released, and the rising I/O activity is the consequence of increasingly frequent paging.
Incorrect. Heap occupancy measured after garbage collection is stable between 1,050 and 1,120 MB for the whole hour, which is the measurement that would reveal a leak. The I/O growth is on the database write path, and no paging figure is presented.
The database server has reached its processing limit, because total CPU utilisation approaches 70% once the I/O wait share is added to the user time, and that is close to the level at which queueing for the processor begins.
Incorrect. Time spent waiting for I/O is time the processor is idle with respect to work it could perform; adding it to user time does not produce a meaningful processing utilisation figure. User CPU stays flat at about 30%, so the processor is not the constraint.
The result is inconclusive because the run never reached a steady state: response time was still rising at minute 60, so the test should be extended until response time stabilises before any resource can be identified as the cause.
Incorrect. The offered load was in steady state from the start, and the response time is rising because a resource is saturating, which is a finding rather than a reason to keep waiting. Extending the run would deepen the queue without adding diagnostic information.
The load is constant, so the degradation cannot be attributed to added users. The write I/O rate rises until it flattens just below the provisioned device limit of 5,000 operations per second, the disk queue length grows to 14, and the CPU spends an increasing share of its time waiting for I/O while user CPU stays flat: requests are queueing for the storage device. Stable heap occupancy after garbage collection rules out a memory leak, and the flat user CPU rules out a processing limit. I/O rate is one of the resource utilisation metrics the syllabus lists, and this pattern is what its saturation looks like.
Citizens complain that the government permit portal is slow to open, mostly when…
Citizens complain that the government permit portal is slow to open, mostly when they use it from mobile networks. The portal team disputes this, pointing at server-side application metrics that show an average processing time of 0.35 s for the landing page and a 90th percentile of 0.6 s, with CPU below 30% on every tier. The performance test team instrumented a client and measured the elapsed time for a first visit to the landing page as experienced by the user. Average over 500 first visits: 3.1 s, broken down as follows. - DNS resolution: 0.90 s - TCP connection establishment: 0.15 s - TLS handshake: 1.40 s - request sent to first byte received, plus full response: 0.35 s - client-side rendering: 0.30 s The trace also shows that the landing page loads assets from four different host names, that each host name is resolved separately, and that no TLS session is resumed between the assets. What does this data set indicate, and where should the team look?
Connection establishment dominates the user's elapsed time: DNS resolution and the TLS handshake together account for 2.30 s of the 3.1 s and are invisible to server-side metrics, so the team should look at the number of host names resolved, DNS caching, TLS session resumption and connection reuse.
Correct. The server-side figure of 0.35 s is consistent with the client trace; it simply excludes everything that happens before the request arrives. Four separately resolved host names with no session resumption is exactly the configuration that produces this profile.
The mobile network does not provide enough bandwidth for the landing page, since the elapsed time is nearly nine times the server processing time; the team should reduce the page payload and compress the assets before measuring again.
Incorrect. The transfer of the response itself is inside the 0.35 s segment, so payload size is not where the time goes. Compressing assets would leave 2.30 s of DNS and handshake time untouched.
The server-side instrumentation is misconfigured, because a component cannot report 0.35 s while the user waits 3.1 s for the same request; the timers should be corrected so that the two measurements agree before any tuning is attempted.
Incorrect. The two figures measure different intervals and are expected to differ: the server times its own processing, the client times the whole elapsed experience. Both are correct, and reconciling them is what the breakdown already does.
Client-side rendering is the largest contributor that the team can influence, since it is the only segment executed on the device; the front-end assets should be restructured to shorten it before the network path is examined.
Incorrect. Rendering accounts for 0.30 s, less than a tenth of the elapsed time, and it is not the largest addressable segment. The DNS and TLS segments are also influenced by choices the team controls, namely host naming and connection handling.
Almost 2.5 of the 3.1 seconds is consumed before the request even reaches the application: DNS resolution and the TLS handshake dominate, and the server-side metrics cannot see any of it because they start timing when the request arrives. This is why an end-to-end measurement is needed alongside server-side metrics. The remedies lie in connection establishment: fewer host names to resolve, DNS caching behaviour, TLS session resumption and connection reuse.
A university course enrolment system was load tested with 300 virtual users. The…
A university course enrolment system was load tested with 300 virtual users. The scripts were produced by recording an enrolment session and were left with the think times exactly as recorded, which came out at about 1.5 s between steps because the recording tester already knew which courses to pick. Test result: 300 virtual users produced 240 'add course' transactions per second, application server CPU reached 96%, and the average response time was 5.2 s against a 3.0 s target. The team drafted a recommendation to increase application server capacity eightfold before the next enrolment period. Before the recommendation went out, an analyst examined production logs from the previous enrolment week. They show a peak of 4,000 students signed in simultaneously, generating 18 'add course' transactions per second in total, with an average interval of 42 s between consecutive steps because students read course descriptions, check timetable clashes and consult prerequisites. What is the most defensible analysis of this situation?
The recorded think time makes 300 virtual users offer roughly thirteen times the production throughput, so the run is a stress test well beyond the operational profile; the think times have to be set from the observed production behaviour and the test repeated before any capacity recommendation is made.
Correct. 240 transactions per second against a production peak of 18 is a factor of about 13, and the cause is the 1.5-second think time rather than the number of virtual users. The syllabus requires think times to be adjusted so that the intended throughput is generated.
The result is valid and conservative: testing with short think times represents the worst case, so hardware sized against 240 transactions per second will comfortably cover the 18 transactions per second seen in production.
Incorrect. Sizing for thirteen times the real workload is not conservatism but a large and unjustified investment, and a result obtained outside the operational profile also says nothing reliable about behaviour at the real load, where different resources may constrain the system.
The number of virtual users is the problem: 300 should be reduced to about 23, which reproduces 18 transactions per second, and that figure should be reported as the number of concurrent students the system supports.
Incorrect. Reducing the user count does reproduce the throughput, but it also abandons the 4,000 concurrent sessions that production actually holds, which consume memory, connections and session state. Reporting 23 as a concurrency limit would be wrong in the other direction.
The 96% CPU utilisation identifies the application server as the bottleneck regardless of the workload used, so the eightfold capacity increase should stand while the think times are corrected in parallel for future runs.
Incorrect. A resource saturated by an unrealistic workload is not evidence about the real one; at the production rate the constraint may lie elsewhere or nowhere. Acting on the sizing figure before re-running keeps the invalid result in the decision.
With a 1.5-second think time, 300 virtual users offer about thirteen times the throughput that 4,000 real students produce, so the test is not a test at the target load: it is an unplanned stress test far beyond the operational profile. This is the same point the syllabus makes when it says load is determined by throughput rather than by the number of users, and it is why think times have to be tuned to the target throughput. The valid next step is to set the think times from the production interval and re-run, not to size hardware from an unrealistic result.
A warehouse management system was load tested with 900 virtual users emulating…
A warehouse management system was load tested with 900 virtual users emulating handheld barcode scanners. The tool's summary report for the 90-minute run states: - transactions executed: 3,348,000 - average throughput: 620 transactions per second - average transaction response time: 0.80 s, against an acceptance criterion of 2.0 s The virtual user status section of the same report shows that 31% of the transactions ended with a failure. Splitting the response times by outcome gives an average of 0.20 s for the failed transactions and 1.90 s for the transactions that passed. The failures are concentrated in the 'confirm quantity' step and return an application error after the scanner's session token is rejected. A team member proposes to report the run as a pass, on the strength of 620 transactions per second at 0.80 s average, and to raise the failures separately as a scripting defect. What is the correct analysis of this report?
The headline figures are inflated by the failures: failed transactions finish faster, so the valid figures are about 428 transactions per second at an average of 1.90 s for the transactions that actually passed, and no verdict can be given until the 31% failure rate is explained.
Correct. 620 x 0.69 = 428 transactions per second, and the passed-only average of 1.90 s is much closer to the 2.0 s criterion than the reported 0.80 s. The syllabus requires virtual user status to be analysed before the other metrics for exactly this reason.
The throughput figure of 620 transactions per second stands, because the system genuinely received and processed every one of those requests; the response time average should be recalculated from the passed transactions only, giving 1.90 s.
Incorrect. Fixing the response time but keeping the throughput leaves an inconsistent pair of figures: the 620 per second was achieved only because a third of the work was abandoned early. Throughput of completed business transactions is what the acceptance criteria refer to.
The run is a pass with respect to performance, since the measured 0.80 s average is well inside the 2.0 s criterion; the session token failures are a functional matter to be handled separately from the performance verdict.
Incorrect. The 0.80 s average exists only because 31% of the measurements are truncated failures, so it is not a measurement of the system's performance under the intended load. Whether the token problem is functional or environmental does not restore the validity of the figures.
The failure pattern shows that the load generators were saturated and dropped session state, so the run should be repeated with additional generators before any of the reported metrics are analysed further.
Incorrect. Nothing in the report points at the generators, and a rejected session token in one specific step is far more consistent with missing correlation of the token in the script. Assuming generator saturation would leave the most likely cause unexamined.
Failed transactions terminate earlier than successful ones, so they inflate throughput and pull the average response time down. Removing them leaves about 620 x 0.69 = 428 transactions per second at an average of 1.90 s, which is the only defensible pair of figures. The syllabus is explicit that virtual user status is analysed first, because errors distort every other metric: with 31% failures the headline numbers cannot be reported as a pass, whatever the eventual cause of the failures turns out to be.
The operational profile for an airline's check-in service states that boarding…
The operational profile for an airline's check-in service states that boarding passes are issued at an average of 9 per second, spread across the three hours before departures, with no coordination between passengers. While implementing the scenario, a tester inserted a synchronisation point immediately before the 'issue boarding pass' request so that all 400 virtual users would reach that request together and be released simultaneously. The run produced the following results. - 'issue boarding pass' 90th percentile: 9.4 s, against 1.2 s in an earlier run of the same scripts without the synchronisation point - throughput over time: alternating intervals of close to 0 transactions per second and short bursts of about 380 transactions per second - application server CPU: 100% for roughly 4 seconds after each release, then close to idle - no failed transactions The tester proposes to report the 9.4 s figure as the boarding pass response time and to open a high-priority defect against the boarding pass component. What is the most defensible analysis?
The synchronisation point created a burst of simultaneous requests that the operational profile does not contain, so the run never reached a steady state and the 9.4 s figure describes an artificial load pattern; the synchronisation point should be removed and reserved for cases where genuine simultaneity is the risk under test.
Correct. The profile specifies 9 per second with no coordination between passengers, while the run delivered bursts of 380 per second. The sawtooth throughput and alternating CPU confirm the absence of steady state, which is where execution is supposed to focus.
The 9.4 s figure is the worst case for the transaction and should be reported as such, since a performance report has to state the behaviour observed under the most demanding conditions the test was able to create.
Incorrect. A worst case is only meaningful if it can occur: this one was constructed by the test tool rather than derived from the profile. Reporting it as the transaction's response time would misinform the stakeholders who act on the number.
The synchronisation point is what allows the target throughput to be reached with a limited number of virtual users, so it should be retained and the reported response time simply annotated with the burst size that produced it.
Incorrect. Throughput is regulated through think times and the number of virtual users, not by making users act in unison. The bursts here average out to a throughput nowhere near the profile's steady 9 per second, and annotating an invalid figure does not make it usable.
The gap between 1.2 s and 9.4 s reveals a defect in the boarding pass component that appears only at high concurrency, so the defect report should proceed while the scenario design is reviewed afterwards in parallel.
Incorrect. The two runs differ in the load applied, not in the component, so the gap is first of all evidence about the scenario. There may be something to learn about behaviour under bursts, but raising a high-priority defect from a load pattern the business does not have inverts the order of analysis.
The synchronisation point manufactured a burst of 400 simultaneous requests that the operational profile does not contain: real passengers issue boarding passes independently at about 9 per second. The sawtooth throughput and the alternating CPU saturation show that the run never settled into a steady state, and the syllabus places the focus of execution on the steady state. Synchronisation points are legitimate where genuine simultaneity is the risk being tested, such as a mass log-on, but here the measured 9.4 s describes a load pattern that does not exist, so the figure should not be reported as the boarding pass response time.
Chapter 5 · Tools — 3 questions
A hospital IT department is choosing a performance testing tool and has to…
A hospital IT department is choosing a performance testing tool and has to explain the commercial models to its finance committee. The syllabus describes three licensing models for performance testing tools. Which statements about those models are consistent with the syllabus? (Choose all that apply.)
A commercial licence may be granted per seat or per site, and the number of virtual users that may be generated is normally bounded by what has been purchased.
Correct. Seat-based and site-based commercial licensing is the first of the three models in the syllabus, and the purchased virtual user volume is what makes licensing part of the scalability assessment of a tool.
A cloud-based licence charged according to use lets the hospital pay for the volume it actually generates, which suits testing campaigns that are infrequent but need a high peak.
Correct. Pay-as-you-go cloud licensing is the second model named in the syllabus, and its fit with occasional high-volume campaigns is why it is offered as an alternative to owning capacity.
An open source tool carries no licence fee, but support and any capability the tool lacks become the hospital's own effort to provide or to build.
Correct. Open source is the third model in the syllabus, and the absence of a vendor relationship, with the support and customisation effort that follows from it, is the trade-off attached to the absent licence fee.
Open source performance tools are licensed per point of presence, so generating load from several locations requires one licence for each location used.
Incorrect. Per-location charging is a characteristic of some commercial and cloud arrangements, not of open source licensing. Generating from several points of presence is a scalability consideration that applies regardless of the licence model.
A pay-as-you-go cloud licence settles the question of protocol compatibility, because the commercial terms of such offerings cover whichever protocol adapters the system under test turns out to require.
Incorrect. Compatibility, including the protocols supported, is a tool suitability factor in its own right and has to be assessed whatever the commercial model. A provider's catalogue of adapters is one of the things being assessed, not something the licence resolves.
The syllabus names three licensing models: commercial licences granted per seat or per site, cloud-based licences charged according to use (pay as you go), and open source tools. A commercial licence normally bounds the number of virtual users that may be generated; pay-as-you-go suits infrequent high-peak campaigns; open source carries no licence fee but shifts support and any missing capability onto the organisation itself. Open source is not licensed per point of presence, and the commercial model chosen does not settle the question of protocol compatibility.
A team evaluating a performance testing tool for a telecom billing platform is working through the tool suitability factors described in the syllabus, and has reached the factor 'monitoring'. Which questions does that factor cover?
Whether the tool's own monitoring is sufficient for the situation, whether it can be supplemented by other monitoring tools where it is not, and whether its monitoring data can be correlated with the transactions the tool executed.
Correct. These are the three questions the syllabus puts under the monitoring factor, and the third one matters most in practice: monitoring data that cannot be aligned with transactions cannot be used to explain a response time.
Whether the tool's monitoring agents consume so few resources on the servers under test that their presence cannot influence the measurements being taken.
Incorrect. That is the probe effect, which is a general concern about measurement rather than the suitability factor being assessed here. The monitoring factor asks about the sufficiency and the correlatability of what the tool can observe.
Whether the monitoring capability is included in the base licence or has to be purchased as a separately licensed module for each monitored server.
Incorrect. How the capability is charged for belongs to the licensing model. The suitability factor is concerned with whether the monitoring the tool offers is adequate and usable, not with how it is billed.
Whether the tool's monitoring covers the servers thoroughly enough to serve as the platform's production monitoring after release, so that a separate monitoring product is not procured.
Incorrect. Production monitoring is the role the syllabus assigns to monitoring tools in their own right, and it is a separate category from the load testing tool. The suitability factor does not ask the load tool to take that role over.
Under monitoring the syllabus asks whether the tool provides sufficient monitoring for the situation at hand, whether that monitoring can be supplemented by other monitoring tools where it is not sufficient, and whether the monitoring data can be correlated with the transactions the tool executed. The other options belong to different considerations: the probe effect, the commercial model, and the relationship between load tool metrics and server-side monitoring.
A tax authority must test its declaration service for the two days before the…
A tax authority must test its declaration service for the two days before the filing deadline. The agreed load profile requires 24,000 concurrent virtual users submitting declarations, and the traffic has to arrive as it does in production, that is from consumer internet connections across the whole country rather than from one place. The team has the following information about the candidate tool. - On the standard generator machine available to the authority, the tool has been calibrated at up to 3,500 virtual users per host before the host's own CPU utilisation passes 85% and its reported response times start to drift. - The licence currently held covers 5,000 virtual users. - The tool can drive load from cloud regions as well as from the authority's own laboratory, with an additional charge per region used. - The authority's laboratory has a single 1 Gbit/s egress link; the load profile is estimated to require about 1.6 Gbit/s of aggregate traffic. - The tool supports the HTTPS and REST interfaces the service exposes, and the team is experienced with its scripting language. Which tool suitability factor is decisive here, and what does it imply for the test?
Scalability is decisive: 24,000 virtual users at 3,500 per host requires at least seven generator hosts, the licence has to be extended from 5,000 to 24,000 users, and the 1.6 Gbit/s of traffic cannot be pushed through a single 1 Gbit/s laboratory link, so load must be generated from several points of presence with the generators themselves monitored.
Correct. The syllabus defines the scalability factor in terms of the number of concurrent virtual users, licensing, generator machine configuration and generation from multiple points of presence, and all four constraints bind in this scenario while compatibility and understandability do not.
Compatibility is decisive, because generating load from cloud regions and from the laboratory at the same time means the tool has to interoperate with two different network environments and with the interfaces the service exposes from both.
Incorrect. Compatibility covers protocols, interfaces to external components including continuous integration, and platforms, and the stem states that the HTTPS and REST interfaces are supported. Running generators in two places is a deployment question, not a protocol compatibility gap.
Understandability is decisive, because a distributed test of this size can only be operated correctly by testers who understand the tool deeply, and misuse of the tool is a frequently underestimated source of incorrect results.
Incorrect. Understandability is indeed an underestimated factor, but the stem says the team is experienced with the tool's scripting language, so it is not what constrains this test. The binding limits are user volume, licences and generation capacity.
Monitoring is decisive, because with seven or more generator hosts and several cloud regions the tool has to consolidate the measurements from every host into one result set that can be correlated with the transactions.
Incorrect. Consolidating and correlating measurements matters and belongs to the monitoring factor, but it is a consequence of the decision to distribute generation rather than the constraint that forces it. The decision itself is driven by the scalability limits.
Compatibility and understandability are already satisfied: the protocols are supported and the team can use the tool. What is decisive is scalability, which the syllabus describes in terms of the number of concurrent virtual users, licensing, the configuration of the generator machines and generation from several points of presence. 24,000 virtual users at 3,500 per host needs at least seven generator hosts, the 5,000-user licence has to be extended to 24,000, and the 1.6 Gbit/s requirement cannot pass through a single 1 Gbit/s laboratory link, so distributed points of presence are needed both for realism and for capacity.