ISTQB Specialist (CT-PT) Mock Exam #1 — Questions & Answers
Every question in this mock exam, with the correct answer marked and a written rationale behind each option below — for reading and review, not a timed run.
Chapter 1 · Basic Concepts — 6 questions
According to ISO 25010, performance efficiency is broken down into three sub-characteristics. Which of the following is NOT one of them?
Reliability
Correct. Reliability is its own top-level quality characteristic in ISO 25010, sitting alongside performance efficiency rather than inside it.
Time Behavior
Incorrect — Time Behavior is one of the three sub-characteristics. It covers response times, processing times and throughput rates against requirements.
Resource Utilization
Incorrect — Resource Utilization is one of the three. It covers the amounts and types of resources (CPU, memory, disk, network) consumed while performing a function.
Capacity
Incorrect — Capacity is one of the three. It is the maximum limit of a parameter, such as the number of concurrent users or transactions, that the system can sustain.
ISO 25010 defines performance efficiency through Time Behavior, Resource Utilization and Capacity. Reliability is a separate top-level quality characteristic in the same standard, not a sub-characteristic of performance efficiency.
A team runs a test in which the system is held at a constant, entirely normal…
A team runs a test in which the system is held at a constant, entirely normal production-level load for 72 hours without interruption. The goal is not to find the breaking point but to see whether response times drift upwards and whether the Java heap keeps growing across the run. Which type of performance testing is this?
Endurance testing
Correct. A long run at a representative load, watching for drift rather than for a breaking point, is exactly the endurance profile — it targets memory leaks, connection leaks and thread-pool exhaustion.
Stress testing
Incorrect. Stress testing deliberately pushes load beyond the anticipated maximum to find the point at which the system fails and to observe how gracefully it does so. Here the load stays at normal levels.
Spike testing
Incorrect. Spike testing applies sudden, short bursts of load and then removes them, checking recovery. The load in this scenario is deliberately constant.
Scalability testing
Incorrect. Scalability testing determines whether the system can grow to meet future load, usually by adding resources or increasing load in stages. Nothing is being scaled here.
Endurance (soak) testing keeps the system under a sustained, representative load for a long period specifically to expose problems that only appear over time: memory leaks, unreleased database connections, exhausted thread pools, disk fragmentation and unbounded table growth.
A news portal expects a sudden burst of traffic the moment an election result is…
A news portal expects a sudden burst of traffic the moment an election result is announced: an ordinary background level of visitors, then roughly ten times that number arriving within a minute, then a return to the ordinary level a few minutes later. The main concern is whether the site recovers cleanly once the burst has passed. Which type of performance testing best matches this concern?
Spike testing
Correct. A sudden, short, very large increase in load followed by a return to normal, with recovery as the key question, is the defining shape of a spike test.
Stress testing
Incorrect. Stress testing raises load steadily beyond the expected maximum to locate the failure point; it is not primarily about a short burst and the recovery afterwards.
Capacity testing
Incorrect. Capacity testing establishes how many users or transactions the system can handle while still meeting its performance objectives — a sustained question, not a burst-and-recover one.
Endurance testing
Incorrect. Endurance testing holds a representative load for a long period to expose gradual degradation; a few minutes of burst is the opposite profile.
Spike testing applies a sudden, large and short-lived increase in load, then removes it. Its distinguishing purpose is to observe both the system's behaviour during the burst and — crucially — its recovery afterwards.
A performance tester needs to generate load against a legacy thick-client…
A performance tester needs to generate load against a legacy thick-client trading application. There is no documented API, the vendor will not release interface specifications, and driving hundreds of GUI clients is not affordable in the available hardware budget. Network traces between the client and the server are, however, available. Which load generation approach is the most appropriate?
Load generation via captured communication protocols
Correct. Capturing the client-server conversation and replaying it at scale avoids both the missing API and the cost of driving many GUI instances.
Load generation through the user interface
Incorrect. Driving the GUI is precisely what the hardware budget rules out — each simulated user needs a full client instance, which is the most resource-hungry option.
Load generation via APIs
Incorrect. There is no documented API and the vendor will not supply interface specifications, so this approach is not available.
Load generation via crowds
Incorrect. Crowd-based generation uses large numbers of real users in distributed locations. It is poorly repeatable and impractical for a controlled test of an internal trading system.
The syllabus lists four ways of generating load: through the user interface, through crowds, through APIs, and through captured communication protocols. When neither the UI nor an API is a workable driver but client-server traffic can be captured, replaying the captured protocol is the remaining practical option.
Which of the following activities count as STATIC testing types within performance testing?
Reviewing the database schema and entity-relationship diagrams for structures that will not scale
Correct. Schema and ER-diagram review is explicitly a static performance testing activity — problems such as missing indexes or over-normalised joins are found without running anything.
Reviewing SQL queries and stored procedures for inefficient constructs
Correct. Inspecting queries and stored procedures is a static activity and often the cheapest way to remove a performance defect.
Reviewing the network and system architecture for bottlenecks such as a single shared gateway
Correct. Architecture review is listed as a static performance testing type; structural bottlenecks can be identified from the design alone.
Running unit tests with a code profiler attached to measure method execution times
Incorrect. Profiling requires the code to execute, which makes it a dynamic testing type even though it operates at unit level.
Executing a system integration test with 200 virtual users to measure end-to-end response time
Incorrect. This executes the system under load and is therefore dynamic performance testing.
Static performance testing examines artefacts without executing the system: reviews of requirements, of database schemas and entity-relationship diagrams, of queries and stored procedures, of network and system architecture, and of performance-critical sections of code. Anything that runs the system under load is dynamic.
A web application responds acceptably when it is restarted, but over the course…
A web application responds acceptably when it is restarted, but over the course of each working week average response times climb steadily until the operations team reboots the servers on Friday evening. Load volumes are stable throughout the week. Which common performance efficiency failure mode does this describe, and what causes are typically behind it?
Degradation over time — typically memory leaks, disk fragmentation or unchecked growth of database tables
Correct. The signature is that load is unchanged while performance worsens with elapsed time, which points at resources that are consumed but never released or reclaimed.
Slow response under moderate-to-heavy load — resource saturation as concurrency rises
Incorrect. Saturation failures track the load level: performance is fine when few users are active and degrades when many are. Here the load is stable and time is the variable.
Slow response under all levels of load — an inefficient algorithm or unindexed query on the critical path
Incorrect. This failure mode shows slow responses even immediately after a restart with a single user. The application is described as responding acceptably when freshly restarted.
Inadequate handling of errors at the limits of capacity — resource pools and queues that are sized too small
Incorrect. This mode is about ungraceful behaviour once the capacity limit is reached, such as raw error pages or lost transactions, not about gradual drift at normal load.
The syllabus distinguishes: slow response under all load levels, slow response under moderate-to-heavy load (resource saturation), degradation over time, and inadequate handling of errors at the limits. Steady worsening at constant load is degradation over time, typically caused by memory leaks, disk fragmentation or uncontrolled database growth.
Chapter 2 · Performance Measurement Fundamentals — 4 questions
Which approach does the CT-PT syllabus name for deciding which performance metrics should be selected and collected?
Goal-Question-Metric (GQM)
Correct. GQM works top-down from a stated goal, through the questions that would show the goal is achieved, to the metrics that answer them — which keeps collection purposeful.
Failure Mode and Effects Analysis (FMEA)
Incorrect. FMEA is a risk analysis technique for identifying failure modes and their effects; it is not the syllabus approach for selecting performance metrics.
Goal-Question-Metric is not used; metrics are taken from the tool's default report set
Incorrect. Accepting whatever a tool reports by default is exactly the undirected collection that GQM is intended to prevent.
Test Maturity Model integration (TMMi)
Incorrect. TMMi is a process improvement model for test organisations, unrelated to selecting metrics for an individual performance test.
The Goal-Question-Metric (GQM) approach is the method named for metric selection: state the goal, derive the questions that must be answered to know whether the goal is met, and only then choose the metrics that answer those questions.
The syllabus groups typical performance metrics into three categories: the technical environment, the business environment and the operational environment. Which of the following metrics belong to the BUSINESS environment category?
Number of orders processed per hour
Correct. A count of completed business transactions per unit of time is a business environment metric — it speaks directly to commercial throughput rather than to machine behaviour.
Compliance with the agreed service level agreement
Correct. SLA compliance is listed as a business environment metric; it is a contractual, business-facing measure.
Number of idle and busy threads in the application server
Incorrect. Thread pool occupancy is resource utilisation and belongs to the technical environment category.
Time taken to restore the system from a backup
Incorrect. Restore-from-backup timing is an operational environment metric, along with start-up, shutdown, resumption and alerting.
Network latency between the application tier and the database tier
Incorrect. Network latency is a technical environment metric describing infrastructure behaviour.
Business environment metrics express performance in terms the business cares about: business process efficiency, the number of business transactions such as orders processed per hour, compliance with service level agreements, the concurrency of usage and the timing of usage across the day or year.
A tester enables verbose per-method tracing on the application servers so that…
A tester enables verbose per-method tracing on the application servers so that every call is timed and written to disk during a load test. Response times measured with tracing on are substantially worse than those measured with tracing off. What phenomenon does this illustrate, and what is the correct conclusion?
The probe effect — the instrumentation itself is consuming resources and distorting the measurement, so a lighter collection method must be used
Correct. The syllabus warns explicitly that data collection must not influence the system under test; verbose tracing is a classic source of this distortion.
A valid finding — the reported response times are the true ones and the earlier figures were optimistic
Incorrect. The traced figures include overhead that will not exist in production, so treating them as the true values would lead to unnecessary tuning work.
Resource saturation — the servers have reached their capacity limit and more hardware is required
Incorrect. The load did not change between the two measurements; only the instrumentation did, which points at the measurement apparatus and not at capacity.
Incorrect correlation of dynamic values in the load script, causing requests to be replayed against stale sessions
Incorrect. A correlation defect would produce errors and failed transactions, not a uniform slowdown that appears and disappears with tracing.
The 'probe effect' is the distortion introduced when the act of measuring changes the behaviour of the system under test. Instrumentation must be light enough that it does not materially affect the results being gathered.
A performance test finishes with all virtual users reported as passed and…
A performance test finishes with all virtual users reported as passed and acceptable average response times, yet the operations team suspects that database contention occurred during the run. Which of the three key sources of performance metrics is best suited to confirming or ruling out deadlocks, SQL exceptions and internal time-outs?
Log analysis tools applied to the application and database logs
Correct. Deadlocks, SQL exceptions and time-outs are written into application and database logs; log analysis is the source the syllabus associates with exactly these conditions.
The performance test tool's own transaction response time report
Incorrect. The load tool sees only what the client sees. A deadlock that was retried successfully leaves no trace in its transaction report beyond a slightly longer time.
Performance monitoring tools reporting CPU and memory utilisation
Incorrect. Monitoring tools report resource consumption. Contention frequently shows as low CPU with poor response, so utilisation figures alone will not confirm a deadlock.
The aggregated 90th percentile figure recalculated from the raw response time samples
Incorrect. Recomputing a percentile from the same client-side samples adds no new information about what happened inside the database.
The syllabus names three key sources: performance testing tools, performance monitoring tools and log analysis tools. Log analysis is the source specifically associated with deadlocks, SQL exceptions and time-outs, because these are recorded internally by the application and database and are often invisible to the load tool.
Chapter 3 · Performance Testing in the Software Lifecycle — 7 questions
A team is identifying performance risk categories for a native banking app that runs on customer handsets. Which set of risks is characteristic of the MOBILE APPLICATIONS architecture category as described in the syllabus?
Constrained device resources, dependence on location and connection quality, battery drain, memory pressure, device temperature and sensor behaviour
Correct. These are the risks the syllabus specifically attaches to mobile applications; they arise from the device rather than from the server infrastructure.
Auto-scaling behaviour and configuration errors that only manifest when new instances are provisioned
Incorrect. Self-scaling and configuration mistakes belong to the dynamic or cloud-based architecture category.
Predictable batch windows combined with newly exposed access through APIs and web services
Incorrect. That description matches the mainframe category — historically predictable systems now opened up through modern interfaces.
Safety criticality and hard real-time deadlines that must never be exceeded
Incorrect. Safety criticality and hard deadlines characterise the embedded real-time category.
The mobile category is distinguished by constraints that simply do not exist on server-side architectures: limited device resources, dependency on location and connection quality, battery consumption, memory pressure, device temperature and the behaviour of on-board sensors.
A retailer has moved its checkout service to a cloud platform configured to add…
A retailer has moved its checkout service to a cloud platform configured to add instances automatically when average CPU utilisation exceeds a threshold. Why does the syllabus treat this dynamic, cloud-based architecture as its own category of performance risk rather than as an equivalent of a fixed multi-tier deployment?
Because the resource available changes during the run, so the scaling rules themselves become a test object and misconfiguration is a distinct risk
Correct. The syllabus flags self-scaling and configuration errors as the defining risks here — the platform's reaction is part of what has to be tested.
Because cloud platforms cannot be monitored, so no resource utilisation metrics are available
Incorrect. Cloud platforms provide extensive monitoring; the difficulty is interpreting metrics from a changing set of instances, not the absence of metrics.
Because cloud deployments are always faster than on-premises ones, so performance testing is not required
Incorrect. Nothing about cloud hosting guarantees better performance, and the syllabus certainly does not exempt it from testing.
Because load can only be generated from a single point of presence when the system under test is cloud-hosted
Incorrect. Cloud hosting makes multiple points of presence easier, not harder; this is unrelated to why the category is treated separately.
In a self-scaling environment the amount of resource available changes during the test, and misconfigured scaling rules are themselves a performance risk. Results therefore depend on the scaling configuration, and a test can pass simply because the platform grew rather than because the application is efficient.
An insurer is buying a commercial off-the-shelf (COTS) claims package and will configure it for its own use. Regarding performance testing, what does the syllabus say about how responsibility is distributed between the acquirer and the supplier?
The acquiring organisation carries the responsibility, because only it knows its own operational profiles, data volumes and target infrastructure
Correct. The syllabus places performance testing of a COTS product on the acquirer; the supplier cannot have tested against this customer's specific usage and environment.
The supplier carries the responsibility in full, and the acquirer should rely on the supplier's published benchmark figures
Incorrect. Vendor benchmarks are produced on the vendor's configuration with the vendor's data and rarely transfer to a specific customer deployment.
Neither party needs to test, because COTS products are certified before release
Incorrect. No certification covers the acquirer's configuration, data volumes and integrations, which is where COTS performance problems normally appear.
Responsibility is shared equally by contract, and both parties must run the identical test suite
Incorrect. The syllabus does not describe a mandatory equal split, and running identical suites in different environments would not answer the acquirer's question.
For COTS products the syllabus is direct: the responsibility for performance testing lies with the acquiring organisation. The supplier's product is a black box tuned for no particular customer, and only the acquirer knows its own operational profiles, data volumes and infrastructure.
During test monitoring and control of a performance test campaign, results show that the agreed response time target is being missed. Which of the following is an example of a CONTROL MEASURE in the sense used by the syllabus?
Adding memory to the application servers and re-running the affected scenario
Correct. Changing the hardware and re-testing is one of the control measures the syllabus names, alongside adjusting load generation and altering network or software configuration.
Recording the deviation in the test report and closing the test campaign
Incorrect. Recording a result is monitoring, not control. Control is the action taken in response to what monitoring reveals.
Recalculating the 90th percentile from the same run to obtain a more favourable figure
Incorrect. Re-cutting the same data differently changes the presentation, not the system, and is not a control measure.
Interviewing stakeholders to establish the operational profiles for the next release
Incorrect. Gathering operational profile data is a test analysis activity performed before design, not a corrective control measure.
Control measures are the corrective actions available when monitoring shows a deviation: adjusting the amount of load being generated, replacing or adding hardware, and making changes to the network or to the software itself.
In an iterative, Agile lifecycle, where does the syllabus suggest performance testing activities are typically positioned, and what makes this different from a sequential lifecycle?
Performance testing is started in an early or dedicated iteration and repeated continuously, supported by continuous integration and by production monitoring, with performance expressed as non-functional user stories
Correct. The iterative approach spreads performance work across iterations and relies on CI and production feedback, rather than concentrating verification at the end.
Performance testing is deferred to a hardening iteration after the final functional iteration, because performance cannot be measured on partial systems
Incorrect. One of the five principles of performance testing is that it can be conducted on a complete or a partial system, so waiting for feature-completeness is unnecessary and risky.
Performance testing is not applicable in Agile lifecycles because increments are too small to produce meaningful load
Incorrect. Increment size does not prevent performance measurement; small increments in fact make it easier to isolate which change caused a regression.
Performance testing is handled entirely by the operations team through production monitoring, with no test activity inside the iterations
Incorrect. Production monitoring is a valuable additional source of data in Agile, but it supplements rather than replaces testing during the iterations.
In iterative development, performance testing is either started in the very first iteration or given a dedicated iteration, and it continues throughout with continuous integration support and production monitoring. Performance requirements are frequently written as non-functional user stories. In a sequential lifecycle, performance criteria are more commonly treated as acceptance criteria verified phase by phase towards the end.
A payment gateway has a stated requirement that no more than 1% of authorisation…
A payment gateway has a stated requirement that no more than 1% of authorisation requests may exceed 3 seconds. Risk analysis before testing estimated that, without mitigation, roughly 12% of requests would breach the limit at the forecast peak. After two rounds of tuning (a connection pool increase and the removal of a synchronous fraud-check call), the final test run at forecast peak load shows 2.4% of authorisation requests exceeding 3 seconds, with a further 0.3% failing outright. The release board asks the test manager to state the residual performance risk. Which statement expresses the residual risk in the way the syllabus recommends, and draws the correct conclusion for the release decision?
About 2.7% of authorisation requests at forecast peak will either exceed 3 seconds or fail, against an agreed ceiling of 1%; the residual risk is therefore still roughly three times the accepted level and the requirement is not met
Correct. It quantifies the residual risk as a percentage of affected requests, correctly folds the 0.3% outright failures into the count of unserved customers, and compares the result against the agreed 1% ceiling.
The residual risk is low, because tuning reduced the breach rate from 12% to 2.4%, an improvement of 80%
Incorrect. A relative improvement says nothing about whether the requirement is met. The syllabus asks for residual risk against the agreed threshold, and 2.4% still exceeds 1%. It also ignores the failed transactions entirely.
The residual risk cannot be quantified, because performance testing has no clear test oracle; the board should be given a qualitative rating of 'medium' instead
Incorrect. It is true that performance testing often lacks a clear oracle, but here an explicit numeric requirement exists, which is precisely the oracle. The syllabus asks for residual risk to be expressed quantitatively where possible.
The residual risk is zero, because the 0.3% of failing requests should be excluded from the calculation as errors rather than performance results, leaving only slow-but-successful requests to be re-tested
Incorrect. Excluding failures understates the impact on users — and the syllabus warns that failed transactions distort results, since they typically complete faster and inflate the apparent throughput. They must be accounted for, not discarded.
The syllabus recommends expressing residual performance risk quantitatively — for example as the percentage of customers likely to experience a response time above the agreed threshold — rather than as a qualitative label. Failed transactions must be counted alongside slow ones, because a customer whose request errored has certainly not been served within the limit. Here 2.4% + 0.3% = 2.7% against a 1% target, so the requirement is still missed by roughly a factor of three and that is the fact the board needs.
A logistics company runs a three-tier order system: a web tier behind a load…
A logistics company runs a three-tier order system: a web tier behind a load balancer, an application tier, and a single mainframe that is now also exposed to partners through REST services. A performance test at 1.5 times current peak load produces these observations. Web tier: CPU 38%, all instances healthy. Application tier: CPU 44%, thread pool never above 55% occupancy. Mainframe: batch window unchanged and CPU well within its normal envelope, but the REST gateway in front of it shows a queue depth growing steadily throughout the run and a 95th percentile response time of 11 seconds against 0.9 seconds for the same operation submitted through the traditional batch interface. Which analysis of the architectural performance risk is best supported by this evidence?
The risk sits in the newly exposed mainframe access path: the REST gateway is serialising or throttling requests, so work queues in front of a mainframe that is itself far from saturated — this is the mainframe-opened-through-services risk category, not a capacity shortfall
Correct. A growing queue in front of a resource whose own utilisation is low is the signature of a constrained interface, and the enormous gap between the REST and batch figures for the same operation localises it to the gateway.
The application tier is the bottleneck, because its CPU is the highest of the three tiers and a thread pool at 55% is close to exhaustion
Incorrect. 44% CPU and 55% pool occupancy are comfortable figures, and neither is rising towards a limit. Picking the largest number among several low numbers is not analysis.
The mainframe has reached its capacity limit and must be upgraded before the load increase can be supported
Incorrect. The mainframe's own CPU is within its normal envelope and its batch window is unchanged. Upgrading it would spend a large budget without touching the actual constraint.
The load balancer in the web tier is distributing traffic unevenly, which is why the 95th percentile is so much worse than the average
Incorrect. Uneven distribution would show as differing utilisation between web instances, but all instances are reported healthy at 38% — and it would not explain why the batch path for the same operation is fast.
The mainframe risk category in the syllabus is characterised precisely this way: mainframes are historically predictable and well-behaved, but they are increasingly opened up through APIs and web services, and it is the new access path rather than the mainframe itself that introduces the risk. Low CPU everywhere combined with a growing queue at one specific interface points at a constrained serialising component in front of the resource, not at the resource being saturated.
Chapter 4 · Performance Testing Tasks — 20 questions
The Performance Test Plan contains a section on acceptance criteria. The syllabus associates each of the three main performance metric families with the stakeholder group that primarily cares about it. Which pairing is correct?
Response time matters chiefly to the user, throughput chiefly to the business, and resource utilisation chiefly to the system owners
Correct. This is the mapping the syllabus gives, and it is what allows acceptance criteria to be justified to the right audience.
Response time matters chiefly to the business, throughput chiefly to the system owners, and resource utilisation chiefly to the user
Incorrect. Users experience response time directly and have no visibility of resource utilisation, which makes this mapping the reverse of the syllabus position.
All three metrics matter equally to all stakeholder groups, so acceptance criteria should be presented identically to everyone
Incorrect. The syllabus specifically advises differentiating communication between business-focused and technology-focused stakeholders.
Only response time can appear in acceptance criteria, because throughput and resource utilisation cannot be agreed in advance
Incorrect. Throughput and resource utilisation targets are routinely agreed in advance and appear as acceptance criteria in the Performance Test Plan.
The syllabus makes this association explicit: response time is chiefly the user's concern, throughput is chiefly the business's concern, and resource utilisation is chiefly the concern of those running the system.
A team plans to build its performance test data by extracting a copy of the production customer database and masking the personal fields to satisfy GDPR. What caveat does the syllabus attach to this widely used practice?
Masking is normally obligatory, but masked data can lose the real characteristics of the original, so index selectivity and data distribution may no longer be representative
Correct. Replacing values with uniform substitutes can flatten skew and change key cardinality, which alters query plans and makes the measured performance unrepresentative.
Masking removes the need for a separate test environment, because masked data is no longer subject to access restrictions
Incorrect. Masking addresses the content of the data, not the need for an isolated environment, and masked data usually remains access-controlled.
Masked production data is always superior to synthetically generated data, so synthetic generation should never be used in performance testing
Incorrect. The syllabus states no such absolute rule; synthetic generation is a legitimate option, particularly where volumes beyond current production are required.
Masking is only necessary if the test environment is hosted externally; internal environments are exempt from data protection obligations
Incorrect. Data protection obligations follow the personal data, not the location of the server, and internal test environments are not exempt.
Anonymising or masking production data is generally mandatory under data protection regulation, but the syllabus warns that masked data may lose the real characteristics of the original — distributions, key cardinality, string lengths and skew — which are exactly the properties that drive database performance.
A test environment for a performance test is a scaled-down copy of production: it has half the application servers and a database on smaller hardware. The team intends to measure there and then extrapolate to production capacity. Which statement reflects the syllabus position on this practice?
It is a normal and often unavoidable compromise, but the extrapolation is unreliable because performance is a non-linear function of the environment, and that uncertainty must be stated in the report
Correct. Halving the hardware does not simply halve the capacity: caches, connection pools and contention behave non-linearly, so the extrapolation must be presented with its uncertainty.
It is acceptable and accurate, because performance scales linearly with the number of application servers as long as the architecture is unchanged
Incorrect. Linear scaling is exactly the assumption the syllabus warns against; shared resources and contention break it.
It is forbidden — performance testing may only be carried out on an exact replica of production
Incorrect. The syllabus explicitly acknowledges that the test environment is commonly a reduced copy of production, and one of the five principles is that testing may be conducted on a partial system.
It is acceptable provided the results are reported as raw figures without extrapolation, since raw numbers are never misleading
Incorrect. The syllabus warns the opposite — raw figures on their own are frequently misleading, and reporting them without context is a known pitfall.
The syllabus accepts that a reduced-scale environment is often the only affordable option and that extrapolation will be necessary, while warning that performance is a non-linear function of the environment, so extrapolation carries real uncertainty that must be made explicit.
When choosing which communication protocol a load script should drive, the…
When choosing which communication protocol a load script should drive, the syllabus notes that the protocols most commonly used in performance testing sit at the upper layers of the OSI model (ISO/IEC 7498-1), that is layers 5 to 7. Which of the following are named in the syllabus as protocols or interfaces used at those layers for database and web-service access?
JDBC and ODBC for database access
Correct. Both are listed as the database access interfaces a load script may drive directly, bypassing the user interface entirely.
SOAP and REST for web services
Correct. These are the two web-service styles the syllabus names for driving load at the service layer.
HTTP and HTTPS for web access
Correct. HTTP and HTTPS, together with HTML, are the web protocols listed for protocol-level scripting.
TCP and UDP as the transport for all scripted traffic
Incorrect in this context. TCP and UDP are transport-layer (layer 4) protocols; the syllabus point is that scripting is normally done at layers 5 to 7, above them.
Ethernet framing at the data-link layer
Incorrect. Ethernet operates at layer 2, far below the range the syllabus identifies as relevant for scripting load.
The syllabus groups the commonly scripted protocols: database access via ODBC and JDBC, web access via HTTP, HTTPS and HTML, and web services via SOAP and REST, alongside network protocols such as DNS, FTP, IMAP, LDAP, POP3 and SMTP.
A script step simulates a user who submits a search, waits for the results page, then pauses to read it before clicking through. In the terminology used by the syllabus, how do transaction response time, think time and elapsed time relate to each other?
Transaction response time plus think time equals elapsed time
Correct. Elapsed time is the whole wall-clock duration of the step; the portion during which the system was working is the transaction response time and the remainder is think time.
Elapsed time plus think time equals transaction response time
Incorrect. This makes response time the largest of the three, which cannot be right — response time is a component of elapsed time, not the sum containing it.
Transaction response time and elapsed time are synonyms; think time is measured separately and is unrelated
Incorrect. They differ precisely by the think time, which is why removing think time from a script increases the load generated without adding virtual users.
Think time is the server processing time and transaction response time adds the network latency on top of it
Incorrect. Think time models the human pause, not server processing. Server processing and network latency are both inside the transaction response time.
The syllabus states the relationship directly: transaction response time plus think time equals elapsed time. Think time is the time the simulated user spends not interacting with the system; it does not consume server resources but it does determine how much load a given number of virtual users generates.
The syllabus describes constructing operational profiles as a three-step activity. Which sequence and emphasis matches that description?
Identify the data needed by persona or role, gather it from stakeholder interviews and production logs, then construct the profiles top-down
Correct. This matches the syllabus sequence, including its explicit recommendation to build the profiles top-down rather than assembling them from individual transactions upwards.
Record a single representative user session, multiply it by the expected number of users, then adjust the total until it matches the desired throughput
Incorrect. One recorded session cannot represent a mixed user population, and scaling it uniformly ignores the different behaviours of different roles.
Construct the profiles bottom-up from individual database queries, then aggregate them into transactions and finally into user journeys
Incorrect. The syllabus specifically recommends a top-down construction; starting from queries loses the business context that determines realistic mixes.
Ask the development team which functions they consider most performance-critical and build profiles exclusively around those
Incorrect. Developer intuition about criticality is not a substitute for data on how the system is actually used, which is what interviews and log analysis provide.
The three steps are: identify the data needed, typically organised around personas or user roles; gather the data, through interviews with stakeholders and through analysis of production logs; and construct the profiles, which the syllabus recommends doing top-down.
A recorded load script replays without error against a single user but produces…
A recorded load script replays without error against a single user but produces a flood of authorisation failures the moment it is run with more than one virtual user. According to the syllabus, what is the single most common reason that recorded scripts fail to replay correctly, and what is the remedy?
Incorrect or missing correlation — dynamic values such as session identifiers and tokens must be captured from each response at run time and fed into subsequent requests instead of replaying the recorded literals
Correct. The syllabus names faulty correlation as the main cause of replay failure, and the symptom described — fine with one user, failing with many — is its classic signature, since all users would otherwise replay one recorded session identifier.
Think times that are too short — the script must be slowed down until the authorisation failures disappear
Incorrect. Adjusting think times changes the throughput generated, but it does not repair a request that carries an invalid session identifier.
The load generator is under-resourced — more load generator machines are needed before the script can replay
Incorrect. An overloaded generator produces distorted timings and dropped requests, not systematic authorisation failures that appear as soon as a second user joins.
The protocol chosen for recording sits at too high a layer of the OSI model, and recording should be repeated at the transport layer
Incorrect. Recording at the transport layer would make the script harder to parameterise, not easier, and the syllabus points to layers 5 to 7 as the appropriate range.
The syllabus is unambiguous that incorrect or missing correlation is the principal reason recorded scripts do not replay. Correlation means capturing values generated dynamically by the server during the run — session identifiers, tokens, generated record keys — and substituting them into subsequent requests instead of replaying the hard-coded values captured at record time.
The syllabus describes a standard three-part structure for a performance test script. What belongs in each part, and why does the structure matter?
An initialization section run once, a main section repeated each iteration and carrying the transaction timers, and a clean-up section run once at the end — so that one-off work is not measured as part of the repeated transactions
Correct. Separating one-off setup and teardown from the repeated body is what keeps the timed transactions representative of steady-state behaviour.
A recording section, a playback section and a reporting section, executed in that order by the load management console
Incorrect. Recording and reporting are activities of the tooling and the test process, not sections within an individual script.
A section per OSI layer being driven, so that layer 5, layer 6 and layer 7 traffic can be timed independently
Incorrect. Scripts are not partitioned by OSI layer; the layering concerns which protocol is driven, not the internal structure of the script.
A login section, a think-time section and a logout section, with all measurement taken across the whole script as a single timer
Incorrect. Timing the whole script as one transaction destroys the ability to attribute a slowdown to a specific business operation, which is the point of placing individual timers.
A script has an initialization section (executed once, for example logging in and establishing a session), a main section that is repeated for each iteration and normally carries the timers around the transactions of interest, and a clean-up section executed once at the end, for example logging out and releasing resources. Keeping one-off work out of the repeated section prevents it from distorting the measured transactions.
During execution, the syllabus advises focusing analysis on the steady state of a run, while noting an important class of exceptions. Which statement captures both the rule and the exception correctly?
Analysis normally concentrates on the steady state, but transient states are the object of interest for mass log-on scenarios and spike tests, where averaging across the whole run conceals the effect being investigated
Correct. This is exactly the distinction the syllabus draws — the transient period is noise in a load test but is the subject itself in a spike or mass log-on test.
Only the steady state should ever be analysed; measurements taken during ramp-up and ramp-down should always be discarded as invalid
Incorrect. Discarding transient data unconditionally would make it impossible to test the very scenarios — spikes and mass log-on — in which the transient behaviour is the requirement.
Only transient states matter, because a system that survives the ramp-up will by definition sustain the steady load that follows
Incorrect. Surviving ramp-up says nothing about behaviour over a sustained period, which is precisely why endurance testing exists.
The distinction is irrelevant provided the run is long enough, because the average over a sufficiently long run converges on the steady-state value
Incorrect. Convergence of the average does not recover the transient behaviour, and it is that behaviour — not its dilution — that a spike test is designed to expose.
Most performance analysis concentrates on the steady state, once ramp-up has completed and behaviour has stabilised. Transient states matter in their own right for scenarios such as mass log-on at the start of a working day and for spike tests, where averages taken across the whole run are actively misleading.
Which sections does the syllabus identify as making up a performance test report?
Executive summary
Correct. The executive summary opens the report and is aimed at stakeholders who will not read the detail.
Test results, including a baseline snapshot to compare against
Correct. The syllabus specifies that results should be accompanied by a baseline, since a number without a reference point cannot be interpreted.
Recommendations
Correct. Recommendations close the report and turn the measurements into proposed action.
The full source code of every load script used in the campaign
Incorrect. Scripts are test artefacts maintained separately; the syllabus does not include them as a section of the report.
A signed acceptance certificate from each business stakeholder
Incorrect. Formal sign-off is a governance artefact of the release process, not a section of the performance test report as described in the syllabus.
The report structure given in the syllabus comprises an executive summary, the test results (including a baseline snapshot for comparison), the test logs, and recommendations.
A load scenario is built from a single script. Each virtual user repeats one…
A load scenario is built from a single script. Each virtual user repeats one iteration continuously: a balance enquiry whose transaction response time is 2 seconds, followed by a think time of 10 seconds. The scenario runs 600 virtual users in steady state. Using the throughput relationship given in the syllabus, what system throughput does this scenario generate?
50 transactions per second
Correct. 600 / (2 + 10) = 50. Each user completes one iteration every 12 seconds, so 600 users produce 50 completed transactions in each second of steady state.
300 transactions per second
Incorrect. This divides the virtual users by the transaction response time alone (600 / 2) and omits the think time, which greatly overstates the load actually generated.
60 transactions per second
Incorrect. This divides the virtual users by the think time alone (600 / 10). The processing time is part of the iteration cycle and must be included in the denominator.
600 transactions per second
Incorrect. This assumes every virtual user completes a transaction every second, which would only be true if the iteration cycle time were exactly one second.
The syllabus gives System throughput = [number of virtual users] / ([processing time] + [think time]). Here that is 600 / (2 + 10) = 600 / 12 = 50 transactions per second. The important consequence is that the generated load is governed by the iteration cycle time, not by the head-count of virtual users alone.
A business stakeholder states the requirement as a throughput target: the order…
A business stakeholder states the requirement as a throughput target: the order service must sustain 120 completed orders per minute. Measurement on the existing system shows that placing an order has a transaction response time of 3 seconds, and analysis of production logs shows that a typical user pauses for 27 seconds between orders. How many concurrent virtual users must the load profile contain to generate the required throughput?
60 concurrent virtual users
Correct. 120 orders per minute is 2 per second; the iteration cycle is 3 + 27 = 30 seconds; 2 × 30 = 60 virtual users.
120 concurrent virtual users
Incorrect. This equates the number of virtual users to the hourly-style throughput figure directly, which only holds if each user completes exactly one transaction per minute — here the cycle is 30 seconds, not 60.
6 concurrent virtual users
Incorrect. This uses only the 3-second processing time as the cycle (2 × 3 = 6) and drops the think time, which understates the required population tenfold.
3 600 concurrent virtual users
Incorrect. This multiplies the per-minute target by the 30-second cycle without first converting the target to a per-second rate, inflating the answer by a factor of 60.
Rearranging System throughput = [virtual users] / ([processing time] + [think time]) gives virtual users = throughput × cycle time. The target of 120 orders per minute is 2 orders per second, and the cycle time is 3 + 27 = 30 seconds, so 2 × 30 = 60 concurrent virtual users are required.
An HR system is used lightly through the night by around 100 batch and…
An HR system is used lightly through the night by around 100 batch and integration sessions. On the first working day of each month, employees log in to submit timesheets, and the operational profile shows the population climbing from that background level to about 220 concurrent users over the first hour of the working day, remaining there for roughly two hours, then falling away. The team must build a load profile that lets them observe the system at the peak and also see how it behaves while the population is climbing. Which load profile should be constructed?
Hold 100 background virtual users throughout, ramp up in steps to 220 over one hour, sustain 220 for two hours, then ramp down — with the steps chosen so response times can be read at each intermediate population
Correct. It reproduces the real shape of the operational profile, preserves the background load that competes for the same resources, and the stepped ramp is what makes the climb observable rather than just the peak.
Start all 220 virtual users simultaneously and run for two hours, since only the peak population is contractually required
Incorrect. An instantaneous start makes the whole ramp period unobservable, and it also creates a mass log-on transient that is not what the profile describes.
Ramp continuously from 0 to 220 over three hours without any hold period, and report the response time at the moment 220 is reached
Incorrect. With no hold at the peak the system never reaches steady state, so the single reading at 220 reflects a transient and is not comparable with the two-hour requirement. It also drops the 100 background sessions.
Run 220 virtual users with the think times removed so that the two-hour peak can be compressed into a fifteen-minute run
Incorrect. Removing think times changes the throughput generated and destroys the relationship between the population and the load, and a fifteen-minute run cannot substitute for two hours of sustained peak.
A load profile specifies how many virtual users execute the operational profiles over time. The syllabus works through an example of exactly this shape: a constant background population, a ramp-up in steps to the peak, a sustained period at the peak, and a ramp-down. The stepped ramp allows the response at each intermediate population to be read off, which a single instantaneous jump would not permit.
A run has just completed and the tester has the full set of results available…
A run has just completed and the tester has the full set of results available: virtual user status, transaction response times, transactions per second, transaction failures, hits per second, network throughput and the distribution of HTTP response codes. Applying the analysis order recommended by the syllabus, which item should be examined FIRST, and for what reason?
Virtual user status, because errored or failed users invalidate every other figure in the run — failed transactions complete faster and inflate throughput, and response time statistics are computed over work that was never really done
Correct. This is the order the syllabus gives, and the reason is that all remaining metrics are conditional on the run having actually executed the intended work.
Transaction response time, because it is the metric named in the acceptance criteria and therefore determines pass or fail
Incorrect. It is the metric that matters most to users, but reading it before confirming the run was valid risks passing or failing the system on figures drawn from a broken run.
Network throughput in bits per second, because a saturated network would explain any other symptom that follows
Incorrect. Network throughput is examined later in the recommended order, after user status, response times, transactions per second, failures and hits per second.
The distribution of HTTP response codes, because codes 200, 302, 304 and 404 reveal the true error rate before any timing is considered
Incorrect. Response codes are useful and are examined, but they come last in the recommended order — and virtual user status already captures whether users completed their work, at a higher level.
The syllabus recommends beginning with virtual user status. If virtual users failed or errored during the run, every other metric is distorted — failed transactions complete faster and inflate the apparent throughput, and response time averages are computed over a population that never did the intended work. Establishing that the run itself was valid must precede interpreting any of its numbers.
The acceptance criterion for an e-commerce checkout reads: "at least 90% of…
The acceptance criterion for an e-commerce checkout reads: "at least 90% of checkout transactions shall complete within 2.00 seconds". A single steady-state run produced 10 000 checkout transactions. The tester plots their distribution and marks the aggregate figures on it. The average is 1.34 s, the 90th percentile is 1.41 s and the 95th percentile is 4.24 s; 8% of transactions exceeded the 2.00 s limit.
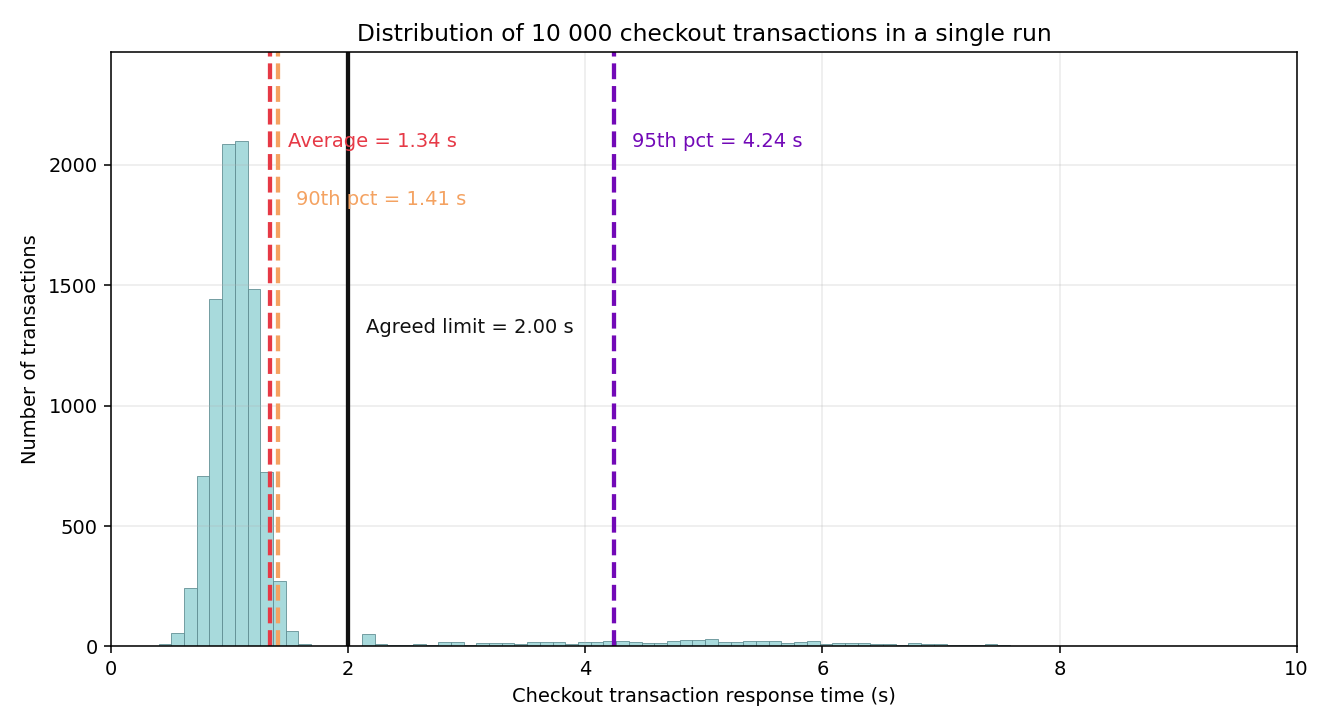
Which analysis of this result is best supported by the plot?
The criterion is met on the letter of the wording, but the distribution is bimodal: roughly 8% of transactions form a separate cluster around 4–5 seconds, which indicates a distinct execution path rather than ordinary variation, and this should be investigated and reported rather than hidden behind the passing 90th percentile
Correct. Two separated modes cannot be produced by ordinary variance around one behaviour; the honest reading is that the criterion passes while a second, materially slower population exists and needs a cause.
The criterion is failed, because the 95th percentile of 4.24 s is more than double the 2.00 s limit
Incorrect. The criterion is stated at the 90th percentile, and 90% of transactions did complete within 2.00 s. Substituting a stricter percentile than the one agreed changes the requirement rather than evaluating it.
The result is a clean pass and no further analysis is warranted, since both the average of 1.34 s and the 90th percentile of 1.41 s are comfortably inside the 2.00 s limit
Incorrect. The average and the 90th percentile happen to fall inside the dense first mode, which is exactly why they say nothing about the second cluster. Reporting them alone is the misuse of aggregates the syllabus warns against.
The plot shows normal statistical scatter around a mean of 1.34 s, and the transactions above 2 s are outliers that should be trimmed before the percentiles are recalculated
Incorrect. A normal scatter produces a single mode with thinning tails, not a second cluster containing 800 transactions. Trimming 8% of the population as outliers would remove the finding rather than explain it.
The distribution is clearly bimodal: a dense cluster around 1 second and a distinct, separate population between roughly 2.5 and 8 seconds. The acceptance criterion is technically satisfied — 92% of transactions were within 2.00 s and the 90th percentile is 1.41 s — but the aggregate figures conceal the existence of a second population that behaves quite differently. The syllabus warns that raw and aggregated figures are misleading on their own, and that the analyst should correlate metrics to locate the cause. A second mode almost always means a subset of transactions is taking a different execution path, and that is what should be investigated before the result is reported as a pass.
A 12-hour endurance run was executed against a Java application at a constant…
A 12-hour endurance run was executed against a Java application at a constant, rate-driven 120 transactions per second. The load generators reported no failed virtual users for the whole run. The tester correlates four metrics over the elapsed time of the run: average transaction response time, CPU utilisation, throughput in transactions per second, and JVM heap in use immediately after a full garbage collection.
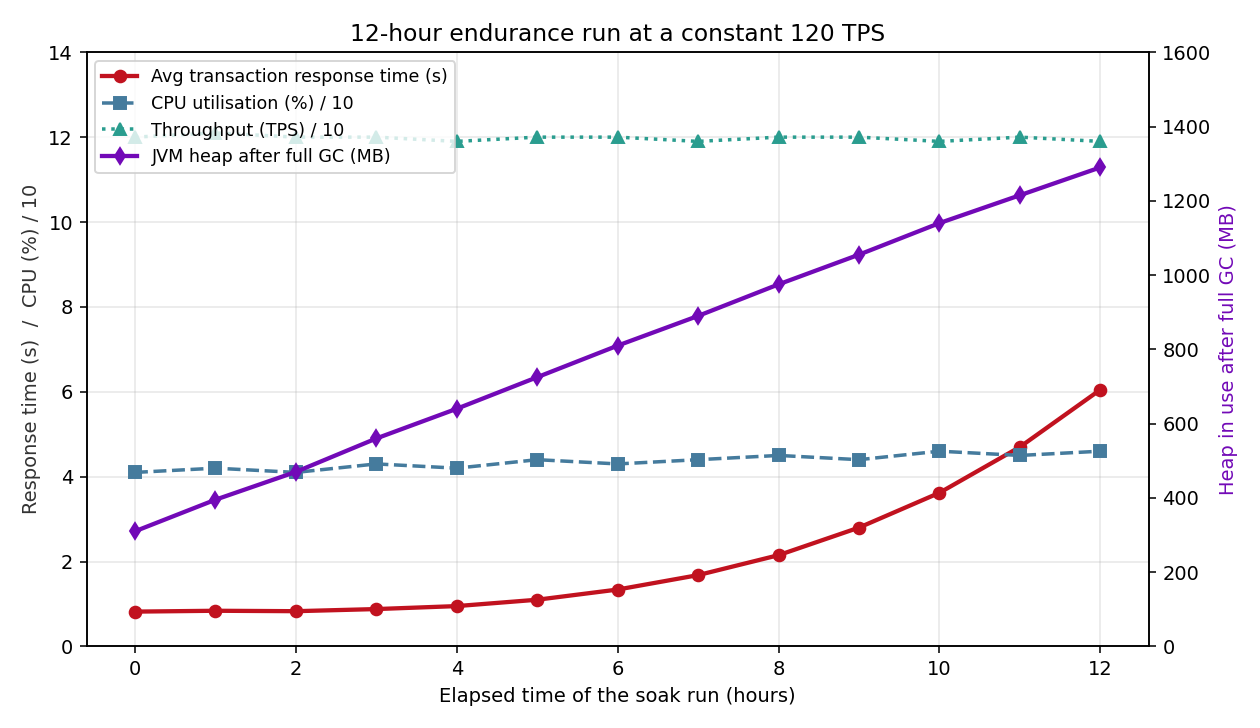
Which root-cause analysis is best supported by this combination of metrics, and what follow-up does it call for?
A memory leak: heap retained after full garbage collection climbs monotonically under an unchanged load, so objects are being held and never released, and the growing collection cost is what drives response time up — the follow-up is heap profiling to identify the retained object graph, not additional hardware
Correct. Post-full-GC heap is the diagnostic figure, because it excludes ordinary garbage; a linear rise at constant load is the definitive leak signature, and it identifies degradation over time as the failure mode.
Resource saturation: the servers have run out of processing capacity at 120 TPS and additional CPU must be provisioned before the test is repeated
Incorrect. CPU utilisation never leaves the 41–46% band across the entire run. Saturation would show utilisation climbing towards its ceiling as response times worsen, and it would not be time-dependent at a constant load.
The load profile is faulty: throughput drifted upwards during the run, and the rising response time is simply the system's correct reaction to more work arriving
Incorrect. Throughput is flat at approximately 120 TPS for the whole 12 hours, which is what makes elapsed time rather than load the only variable that changed.
The probe effect: the monitoring agent collecting heap statistics is itself consuming memory and slowing the application, so the run should be repeated with monitoring disabled
Incorrect. The probe effect would impose a roughly constant overhead from the start rather than a steadily worsening one, and disabling the monitoring would remove the very evidence needed to characterise the defect.
The decisive signal is the heap in use immediately after a full garbage collection rising almost linearly while the load is unchanged. Memory that survives a full collection is memory the application still holds a reference to, so a monotonic rise means objects are being retained and never released — a memory leak. CPU utilisation staying flat in the low forties rules out resource saturation, and throughput holding at 120 TPS confirms the load itself did not change. This is the 'degradation over time' failure mode, and it is exactly the class of defect endurance testing exists to find.
A team implemented its scripts quickly by hard-coding one customer account…
A team implemented its scripts quickly by hard-coding one customer account number and one product code into the search and order transactions, so that all 400 virtual users work on exactly the same two records. Two runs are then compared. In the search scenario the measured response times are far better than the production baseline, and database CPU is close to idle. In the order scenario the measured response times are far worse than baseline, database CPU is again low, but the database reports a large number of lock waits on a single row. Which conclusions about the effect of the shared test data are correct?
The search results are unrealistically good because the single record is served from cache after its first retrieval, so the measurement never exercises the physical I/O path a real mix of accounts would trigger
Correct. Caching is the distortion the syllabus attaches to shared data on read paths, and near-idle database CPU alongside excellent response times is its signature.
The order results are unrealistically bad because all 400 users contend for a lock on the same row, creating serialisation that would not occur across a realistic spread of records
Correct. Locking is the opposite distortion named in the syllabus, and low CPU combined with heavy lock waits on one row identifies contention rather than a capacity problem.
Neither run can be used to judge the system, and both scripts must be parameterised with a representative spread of accounts and products before the measurements mean anything
Correct. Both results are artefacts of the data design. Parameterisation with realistic data is the remedy the syllabus prescribes.
The search result should be accepted as valid, because caching also occurs in production and the measurement is therefore representative
Incorrect. Caching occurs in production across a wide working set, where the hit rate is far lower. A cache serving one record to 400 users is not the production cache behaviour.
The order result proves the database needs faster storage, since lock waits are a symptom of slow disk writes
Incorrect. Lock waits here arise from many sessions targeting one row; faster storage shortens each write slightly but does not remove the serialisation that the shared record creates.
The syllabus warns that giving every virtual user the same data distorts results in two opposite directions. Read-mostly transactions become unrealistically fast because the single record is served from cache after the first access. Write transactions on a shared record become unrealistically slow because every user contends for the same lock. Both readings are artefacts of the data design, not properties of the system, and the remedy is to parameterise the scripts with a realistic spread of data.
A tester is scaling a scenario from 500 to 4 000 virtual users. Beyond about 2…
A tester is scaling a scenario from 500 to 4 000 virtual users. Beyond about 2 200 users, the reported transaction response times begin to rise sharply, but the application servers show CPU at 51% and the database shows no contention. Investigation reveals that all 4 000 users are being driven from one load generator machine, that the generator's own CPU is at 96%, and that the whole population appears to the application as a single source IP address. Which conclusions and corrective actions are justified?
The measurements above roughly 2 200 users are invalid: the generator at 96% CPU is queuing its own requests, and that delay is being recorded as system response time
Correct. This is why the syllabus insists on monitoring the load generators themselves — a saturated generator manufactures response time that has nothing to do with the system under test.
Load generation should be distributed across several machines, ideally from more than one point of presence, and the run repeated
Correct. Distributing generation removes the generator bottleneck and, from multiple points of presence, also produces a more realistic network path.
Presenting the entire population from one source address may itself distort the result if the system applies per-address load balancing, connection limits or throttling; IP spoofing on the generator addresses this
Correct. The syllabus names IP spoofing for exactly this purpose — a single source address can defeat load-balancing and trigger per-client limits that real users would never hit collectively.
The application servers are the bottleneck, because 51% CPU at 2 200 users extrapolates linearly to over 90% at 4 000 users
Incorrect. Linear extrapolation of CPU is unsound — the syllabus notes performance is a non-linear function of the environment — and in any case 51% measured is not evidence of saturation.
The result should be reported as the system's capacity limit, since 2 200 users is where the measured response time began to degrade
Incorrect. Reporting the generator's limit as the system's capacity would understate the true capacity and could trigger an unnecessary hardware purchase.
The syllabus stresses that load generators must themselves be monitored, because a saturated generator produces inflated response times that are attributed to the system under test. It also describes distributing generation across several machines and multiple points of presence, and mentions IP spoofing as a technique for making a single generator appear as many client addresses — which matters when the system under test applies per-address load balancing, throttling or connection limits.
A scenario is run with a fixed think time of 5 seconds. As virtual users are…
A scenario is run with a fixed think time of 5 seconds. As virtual users are added in steps, measured throughput rises to 400 transactions per second at 3 000 users and then stops rising: at 4 000 and 5 000 users throughput remains at approximately 400 transactions per second while the transaction response time climbs from 2.5 s to 7.5 s. A junior tester concludes that the load generation is broken because adding users no longer adds load. What is the correct interpretation?
The scenario is a closed system, so once the system saturates its service rate caps throughput at about 400 transactions per second; extra users cannot create extra work and instead accumulate as waiting time, which is why response time rises while throughput stays flat — 400 TPS is the measured capacity
Correct. In a closed system each user has at most one outstanding request, so beyond saturation the arrival rate is governed by the system's own completion rate. The flat throughput with rising response time is the finding, not an error.
The load generation is indeed broken, because throughput must always increase in proportion to the number of virtual users
Incorrect. Throughput is proportional to the population only while the system keeps up. The syllabus explicitly warns that the number of users does not determine load — throughput does.
The think time of 5 seconds is capping throughput at 400 transactions per second, and reducing it to zero would allow throughput to keep growing linearly with the population
Incorrect. Removing think time would raise the offered rate, but the system is already returning its maximum completion rate; the ceiling is the system's service capacity, not the think time. Response time rising to 7.5 s while throughput is flat shows the constraint is downstream.
The results should be discarded because response time above 2 s violates the usual seven-second rule for web applications
Incorrect. The seven-second guideline is a usability expectation, not a criterion for whether a measurement is valid, and discarding the data would throw away the capacity finding the run produced.
This scenario is a closed system: each virtual user waits for its own transaction to complete before starting the next iteration. Once the system saturates, its service rate caps the throughput, and additional users simply wait longer rather than producing more work. Throughput flattening while response time rises in proportion to the added population is the expected signature of a saturated closed system, not a defect in load generation. The syllabus makes exactly this point when it stresses that load is determined by throughput rather than by the number of users.
As a verification technique, a team runs a small number of GUI-driven scripts…
As a verification technique, a team runs a small number of GUI-driven scripts alongside the main protocol-level load test. At 1 500 virtual users the protocol scripts report an average 'view dashboard' response time of 1.1 seconds, while the GUI scripts running at the same moment report 6.8 seconds for the same operation. Both sets of scripts are correct and the clocks on all machines are synchronised. What is the most sound analysis of this discrepancy?
Both figures are valid and measure different things: the protocol script covers server and network time only, while the GUI script covers the full end-to-end experience including rendering and client-side processing — so roughly 5.7 seconds is being spent in the browser and the user-facing result is 6.8 seconds
Correct. This is the reason the syllabus recommends the technique: the gap between the two measurements localises cost to the client side, which a protocol test alone can never reveal.
The GUI scripts are wrong, because a protocol-level measurement is closer to the truth and should be the one reported
Incorrect. The protocol figure is closer to the server, not closer to the truth about what the user experiences. Reporting 1.1 s would tell stakeholders the dashboard is six times faster than it is.
The protocol scripts are wrong, because a correlation defect is causing them to record incomplete responses that return early
Incorrect. A correlation defect produces errors or wrong content, which would show up as failed transactions; here both script sets complete successfully and simply measure different boundaries.
The GUI-driving machines are experiencing the probe effect, so the two figures should be averaged to obtain the real response time
Incorrect. Averaging measurements of two different things produces a number that describes neither. GUI drivers are certainly resource-hungry and must be monitored, but that possibility should be checked, not compensated for by arithmetic.
A protocol-level script measures only the server and the network. A GUI-driven script measures the complete end-to-end experience, including everything the browser does after the response arrives: parsing, rendering, executing client-side script and issuing dependent requests. A large gap between the two therefore locates the cost on the client side, and it is a genuine user-visible finding rather than a scripting fault — which is precisely why the syllabus recommends running GUI scripts alongside a protocol test as a verification technique.
Chapter 5 · Tools — 3 questions
Which categories of tool does the syllabus identify as making up the tooling for a performance test?
Load generators, optionally operating from multiple points of presence
Correct. Load generators create the traffic, and running them from several points of presence gives a more realistic network path.
A load management console that coordinates the generators and consolidates their results
Correct. The console is the orchestration layer that starts and synchronises generators and brings the results together.
Monitoring tools, applied to the system under test, to the load generators and to production after release
Correct. The syllabus specifically notes that monitoring must cover the load generators too, and that it continues into production once the system is live.
Static analysis tools that compute the theoretical worst-case execution time from the source code
Incorrect. Static review of critical code is a static performance testing activity, but such a tool is not one of the three categories of performance test tooling named in chapter 5.
Test management tools that store the test cases and their execution status
Incorrect. Test management tooling is general test infrastructure and is not among the three performance-specific tool categories.
Three tool types are described: load generators, which create the virtual users and their traffic and may operate from several points of presence; the load management console, which orchestrates the generators and consolidates results; and monitoring tools, which observe the system under test, the load generators themselves and, after release, production.
Among the four factors the syllabus gives for assessing tool suitability — compatibility, scalability, understandability and monitoring — which one does it single out as being frequently underestimated, and on what grounds?
Understandability — because a tool that demands more technical skill than the team possesses will be used to produce incorrect results, however capable the tool is on paper
Correct. The syllabus explicitly names this as an underestimated factor, and its concern is the correctness of the results an under-skilled team will generate.
Compatibility — because the range of protocols a tool supports is the only factor that cannot be worked around after purchase
Incorrect. Compatibility with protocols, platforms and external interfaces such as CI is genuinely important, but it is not the factor the syllabus identifies as underestimated.
Scalability — because licence limits on the number of concurrent virtual users are usually discovered only during the first large run
Incorrect. Scalability covers virtual user counts, licensing and generator configuration and matters a great deal, but the syllabus does not describe it as the underestimated one.
Monitoring — because a tool with weak monitoring can never be supplemented by separate monitoring products
Incorrect. The reasoning is also wrong on its own terms: the syllabus asks specifically whether a tool's monitoring can be supplemented, implying that it usually can.
Understandability is the factor the syllabus flags as underestimated. It concerns the level of technical knowledge the tool demands of its users, and the warning is blunt: testers who lack the required skills will produce incorrect results with the tool, whatever its technical merits.
An organisation must select a performance testing tool for a portfolio that…
An organisation must select a performance testing tool for a portfolio that includes a REST-based microservice platform, a legacy Citrix-published desktop application and a mobile client. The test team consists of two manual testers with no scripting background. Peak scenarios need 12 000 concurrent virtual users, four times a year, and the results must be published automatically into the existing continuous integration pipeline. Tool A supports HTTP and REST only, is licensed per seat with an unlimited virtual user count, and is scriptless. Tool B supports HTTP, Citrix ICA and mobile protocols, offers a cloud pay-as-you-go virtual user model and a CI plug-in, but requires scripts to be written and correlated by hand in a programming language. Assessing both against the four suitability factors, which recommendation is best supported?
Select Tool B, because compatibility with Citrix ICA and mobile is a hard constraint that Tool A cannot meet and its pay-as-you-go model suits four peaks a year — but treat understandability as an identified risk and fund training or a scripting-capable engineer before the first campaign
Correct. It respects compatibility as the constraint that cannot be traded away, reads the licensing model against the actual usage pattern, and does not dismiss the understandability weakness but manages it explicitly.
Select Tool A, because understandability is the factor the syllabus calls most underestimated and a scriptless tool matches the team's current skills
Incorrect. Understandability matters, but a tool that cannot drive two of the three applications leaves the largest performance risks in the portfolio untested. A weakness that can be closed by training should not outweigh a capability the tool simply lacks.
Select Tool A, because its unlimited virtual user licence is the only way to guarantee 12 000 concurrent users, and the Citrix and mobile applications can be covered by manual timing
Incorrect. Manually timing a Citrix desktop or a mobile client cannot generate concurrent load at all, so the peak scenarios for those applications would remain entirely untested.
Buy both tools and use each where it fits, since this scores highest on every suitability factor simultaneously
Incorrect. Two toolsets mean two sets of licences, two skill sets and results that cannot easily be consolidated or correlated — which weakens monitoring and reporting rather than strengthening them, on top of the doubled cost.
Compatibility is a hard constraint: Tool A cannot drive Citrix ICA or the mobile client at all, so it cannot cover the portfolio regardless of its other merits. Scalability favours the pay-as-you-go model, because 12 000 virtual users are needed only four times a year and paying for permanent capacity would be wasteful. Monitoring and CI integration favour Tool B. That leaves understandability as the one factor on which Tool B is weak — and the syllabus treats this as a real risk rather than a formality, since under-skilled testers produce incorrect results. The sound recommendation is therefore Tool B combined with an explicit plan to close the skills gap.